Normalized Difference Vegetation Index PowerPoint
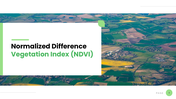

Normalized Difference Vegetation Index PowerPoint, Google Slides, and Canva Template
Think of a plant as a light filter, not a light source. It doesn't glow — it reflects, and what it reflects back tells you almost everything about how healthy it is. Healthy leaves absorb red light to fuel photosynthesis but bounce back near-infrared light almost untouched. Stressed or dying leaves do the opposite. NDVI is just that ratio, turned into a number satellites can measure from orbit — and this template is built to make that single idea land before anything else.
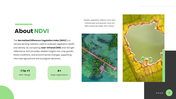
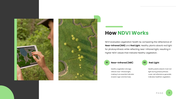
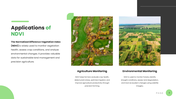
Two slides establish the concept before the deck touches applications: what NDVI is, and the specific mechanism behind it — red light absorbed for photosynthesis, near-infrared light reflected, and the resulting gap between the two producing the index's value. Only after that foundation is laid does the template move into where NDVI actually gets used: crop condition monitoring, land management planning, and broader environmental change tracking, all feeding into decisions that depend on knowing which land is thriving and which isn't.
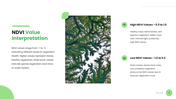
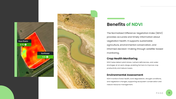
A dedicated value-interpretation slide handles the part that trips up most first-time audiences — the -1 to +1 scale, and what a high number versus a low number actually represents on the ground. It sits deliberately apart from the mechanism slides, because "how it's calculated" and "how to read the result" are two different lessons that get muddled when combined. A benefits slide follows, connecting the data back to sustainable agriculture and conservation outcomes rather than leaving it as an abstract number.
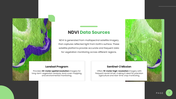
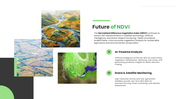
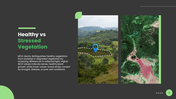
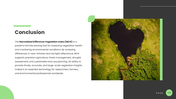
The technical closing stretch covers where the data physically comes from — multispectral satellite imagery capturing reflected light across regions — and where the field is heading, as drones and AI start supplementing traditional satellite passes. A side-by-side healthy-versus-stressed vegetation slide makes the whole concept visible in one glance, and a short conclusion slide closes on NDVI's practical value rather than restating the science.
Built for environmental science courses, GIS teams, and agronomy briefings that need the concept to click on the first pass, not the third. Every diagram, value range, and label is fully editable.
Features of the template
- 100% customizable slides and easy to download.
- Slides are available in different nodes & colors.
- The slide contains 16:9 and 4:3 formats.
- It is easy to change the colors of the slide quickly.
- A well-crafted template with an instant download facility.
Explore Related Collections
Recommended based on this template.

You May Also Like These PowerPoint Templates
Showing20 of69,218 templates