Marvellous Market analysis PPT and Google Slides

 Canva
Canva
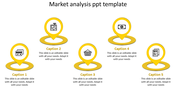

Market Analysis PowerPoint Template and Google Slides Themes
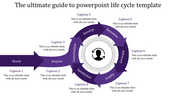
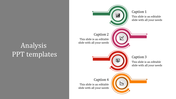
Improve your market insights with our Market Analysis PowerPoint Template and Google Slides Themes. Featuring nine nodes, each with captions, title holders, and text areas, this template is a game-changer for market analysts, financial advisors, and strategic planners.
Explore into market landscapes and competitive analyses effortlessly, crafting compelling narratives that captivate your audience. Empower your presentations with impactful visuals and redefine how you share data.
Download our Market Analysis PowerPoint Template now and unlock the potential of your market
narratives.
Features of the Template
- 100 % customizable slides.
- The slide show is in 4:3, 16:9, zip format.
- There is powerful connectivity with Google Slides and PowerPoint.
- It is simple and quick to alter the slide's color.
- An efficient template that can be easily accessed immediately.
- Well-crafted template with an instant download facility.


You May Also Like These PowerPoint Templates
Add to Wishlist
Download
AI Customize

Add to Wishlist
Download
AI Customize

Add to Wishlist
Download
AI Customize

Add to Wishlist
Download
AI Customize

Add to Wishlist
Download
AI Customize

Add to Wishlist
Download
AI Customize

Add to Wishlist
Download
AI Customize

Add to Wishlist
Download
AI Customize

Add to Wishlist
Download
AI Customize

Add to Wishlist
Download
AI Customize

Add to Wishlist
Download
AI Customize

Add to Wishlist
Download
AI Customize

Add to Wishlist
Download
AI Customize

Add to Wishlist
Download
AI Customize

Add to Wishlist
Download
AI Customize

Add to Wishlist
Download
AI Customize

Add to Wishlist
Download
AI Customize

Add to Wishlist
Download
AI Customize

Add to Wishlist
Download
AI Customize

