Advanced Case Study PowerPoint Template for Analysis

Market analysis slide with three orange location pin graphics displaying percentages 30%, 50%, and 75%.
P.ID : 10134
    11 slides
    Slide deck covering hypothesis testing, with a central six-step process diagram and supporting slides in a white background.
    11 slides
    Flowchart with icons representing predictive analytics elements below with detail analytics processes and value chains.
    13 slides
    3C analysis slides with various triangle shaped layouts in vibrant colors representing company, customers, and competitors.
    11 slides
    Reflective learning slide deck with four colored sections for different types of thinking, centered around a book icon.
    11 slides
    Slide deck with colorful layouts around a central icon, highlighting various aspects of social impact assessment.
    13 slides
    Data analysis slides with flowcharts, icons, and colored segments for statistical methods and machine learning algorithms.
    221 views
    6 Downloads
    Get Custom Slides by Experts
    Instantly Access Templates in PowerPoint

    Gain Insights: Market Analysis PPT Template


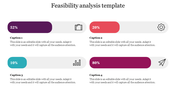
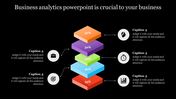
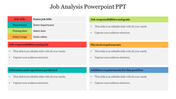
    Present data-driven insights with our Market Analysis PPT Template and Google Slides Themes. It has three attention-grabbing orange-themed pinpoints. Each pinpoint includes a caption and a text area, allowing you to highlight key market trends, opportunities, and threats. Ideal for business analysts, marketers, consultants, and entrepreneurs, this template empowers you to present comprehensive market analyses with clarity and impact. Whether assessing market size, competition, or consumer behavior, our template enables you to communicate your findings effectively. Elevate your presentations and make informed strategic decisions. Capture your audience's attention and drive your message home with our Market Analysis PPT Template and Google Slides Themes.

    Features of the template


    • 100% customizable slides are easy to download.
    • Slides are available in different colors.
    • The slide has 4:3 and 16:9 formats.
    • It is easy to change the slide colors quickly.
    • It has a cute design to impress an audience.
    • Create feature-rich, animated presentations.
    Advertisement

    You May Also Like These PowerPoint Templates

    Add to Wishlist
    Download
    AI Customize
    GROW Coaching Model PPT Presentation And Google Slides
    Add to Wishlist
    Download
    AI Customize
    Lead time analysis PPT slide illustrating the process with three key elements and icons.
    Add to Wishlist
    Download
    AI Customize
    The research methodology slide features a central magnifying glass connected by six colorful icons with text area.
    Add to Wishlist
    Download
    AI Customize
    Collection of slides showing different styles like diamonds, hexagons, and flowcharts, with ethical principles.
    Add to Wishlist
    Download
    AI Customize
    Slide with five numbered colorful arrows with text area on the left, and a pie chart highlighting observation
    Add to Wishlist
    Download
    AI Customize
    A structured 8D analysis slide featuring eight distinct steps, each labeled with a numbered blue bar.
    Free
    Add to Wishlist
    Download
    AI Customize
    Slide pack showing a cost benefit analysis with a scale balancing costs and benefits, using colorful charts and diagrams.
    Add to Wishlist
    Download
    AI Customize
    5C analysis slide deck with various colorful layouts explaining the company, customers, competitors, collaborators, context.
    Add to Wishlist
    Download
    AI Customize
    The data analysis slide has large text, a variety of icons above a person's silhouette, and color options at the bottom.
    Add to Wishlist
    Download
    AI Customize
    Colorful graphic showcasing a situation analysis framework with six labeled sections around a central analysis icon.
    Add to Wishlist
    Download
    AI Customize
    Detailed ISO 9001 gap analysis table, outlining requirements and corrective action processes for nonconformities.
    Add to Wishlist
    Download
    AI Customize
    Colorful circular diagram slide illustrating a situation analysis framework with captions for four categories with icons.
    Add to Wishlist
    Download
    AI Customize
    Slide deck outlining the change readiness assessment process, with four color coded phases and corresponding steps.
    Add to Wishlist
    Download
    AI Customize
    Editable Company Analysis PowerPoint And Google Slides
    Add to Wishlist
    Download
    AI Customize
    Illustration of a break even analysis with a balanced scale, showing percentages in circular shapes on either side.