Market Analysis PowerPoint Template for Strategic Planning

Market analysis PPT slide with three green sections Analysis, Profit, and Customer, and a word cloud in a magnifying glass.
P.ID : 26934
    120 views
    3 Downloads
    Get Custom Slides by Experts
    Instantly Access Templates in PowerPoint

    Market Analysis Presentation Template


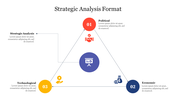
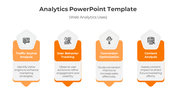
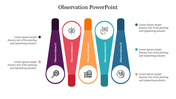
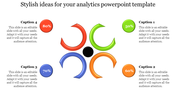
    Gain invaluable insights into market dynamics with our Market Analysis PowerPoint Template. Its user-friendly design empowers you to craft compelling presentations that showcase your research seamlessly.

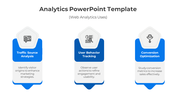
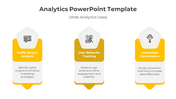
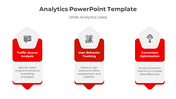
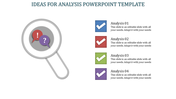
    With three distinct steps visually represented by vivid green icons, you can effortlessly guide your audience through your analysis. The crisp white background and bold fonts ensure optimal clarity and readability.

    Whether you're a business strategist, marketing professional, or industry expert, this template equips you to deliver impactful presentations that drive informed decision-making. Embrace its power and empower your team with the knowledge they need to thrive in today's competitive landscape.

    Feature of the template

    • 100% customizable slides and easy to download.
    • Slides are available in different nodes & colors.
    • The slide is contained in 16:9 and 4:3 format.
    • Easy to change the slide colors quickly.
    • Well-crafted template with an instant download facility. 
    Advertisement

    You May Also Like These PowerPoint Templates

    Add to Wishlist
    Download
    AI Customize
    Analytics PowerPoint slide with colorful bar charts, including icons for graphs, data analysis, and business targets.
    Add to Wishlist
    Download
    AI Customize
    Data analytics template with a magnifying glass in the center and six purple icons arranged around it.
    Add to Wishlist
    Download
    AI Customize
    Slide deck focusing on macro environment factors, using circular charts and colorful blocks for clarity.
    Add to Wishlist
    Download
    AI Customize
    A slide showing the colorful MOSCOW method for project priorities with each category labeled and described on a white theme.
    Add to Wishlist
    Download
    AI Customize
    Red and black diagram with a magnifying glass focusing on three analysis sections with icons inside.
    Add to Wishlist
    Download
    AI Customize
    Market analysis PowerPoint template featuring six percentage milestones from 30 to 90 with corresponding captions.
    Add to Wishlist
    Download
    AI Customize
    Market analysis infographic with a yellow open box at the bottom, connected to four colored captions labeled 1 to 4.
    Add to Wishlist
    Download
    AI Customize
    A PPT slide showcasing a business analytics theme with icons for analysis, data, and insights, surrounded by six captions.
    Add to Wishlist
    Download
    AI Customize
    Business analysis slide showcasing steps with icons around a central illustration with a text description.
    Add to Wishlist
    Download
    AI Customize
    Competitor analysis presentation slide featuring progress bars with business building background with placeholder text.
    Add to Wishlist
    Download
    AI Customize
    The Best Situation Analysis Template Slide Presentation
    Add to Wishlist
    Download
    AI Customize
    Dark themed slide featuring analytics elements, including a magnifying glass, mobile device, and percentages in bold.
    Add to Wishlist
    Download
    AI Customize
    Slides featuring Venn diagrams and flowcharts in blue, purple, and orange, explaining diversity, equity, and inclusion.
    Add to Wishlist
    Download
    AI Customize
    Financial analysis slide with icons of coins, hand with cash, transaction, and refund on clipped sheets.
    Add to Wishlist
    Download
    AI Customize
    Easily Usable Performance PPT And Google Slides Template
    Add to Wishlist
    Download
    AI Customize
    Six pie analysis charts in blue, red, orange, green, teal, and purple, displaying percentages from 15% to 90%.
    Add to Wishlist
    Download
    AI Customize
    A colorful risk analysis matrix slide chart, displaying low, medium, high, and extreme risk levels in a grid format.