Get Data Center PPT Template and Google Slides Themes

Data center template with red server icon and four pie charts showing percentages  with caption areas.
P.ID : 25541
    97 views
    2 Downloads
    Get Custom Slides by Experts
    Instantly Access Templates in PowerPoint

    Optimize Your Data Center: Data Center Template


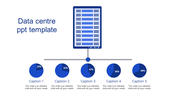
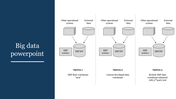
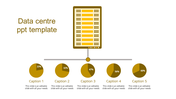
    Streamline your Data Center process with our Data Center PPT Template and Google Slides Themes. This template features a striking red-themed server and four pie charts, each illustrating a percentage level, accompanied by a caption and a text area. The cohesive red theme exudes professionalism and grabs attention.

    Best for IT professionals, data analysts, and system administrators, this template aids in presenting data center strategies, performance metrics, and analysis results. Whether you're showcasing server utilization, data storage trends, or network performance, this versatile tool enhances your presentation's impact.

    Take control of your data center presentations and communicate your insights with our PPT. Optimize your processes, maximize efficiency, and drive success with clarity and precision.

    Features of the template


    • 100% customizable slides are easy to download.
    • Slides are available in different colors.
    • The slide has 4:3 and 16:9 formats.
    • It is easy to change the slide colors quickly.
    • It has a cute design to impress an audience.
    • Create feature-rich, animated presentations.
    Advertisement

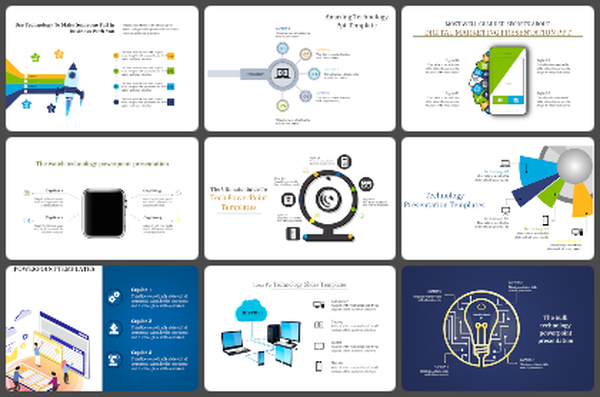
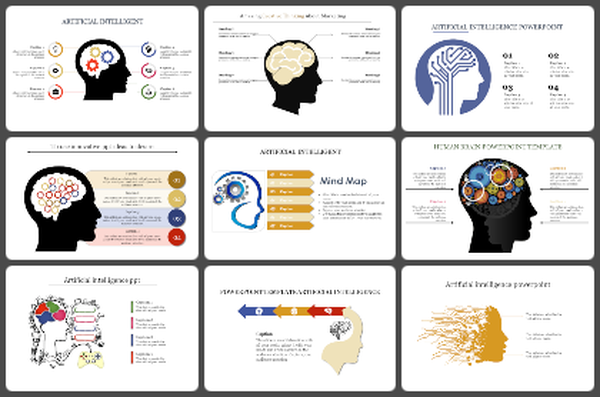
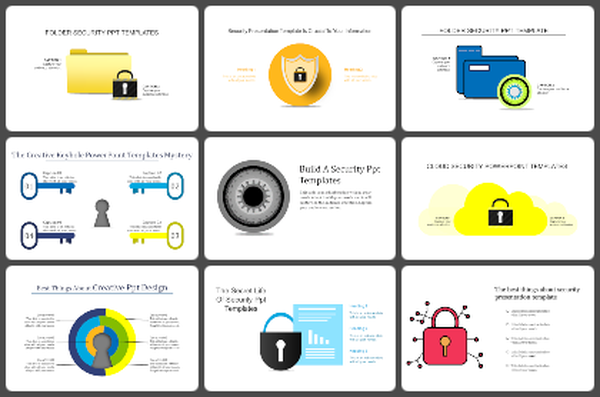
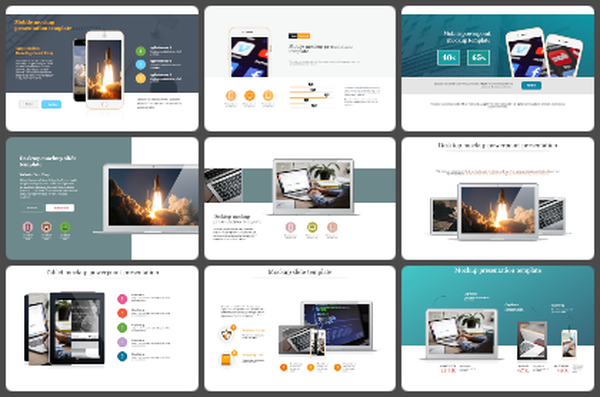
    You May Also Like These PowerPoint Templates

    Add to Wishlist
    Download
    AI Customize
    DBMS diagram showing a local database, request and reply process, an application interacting with the DBMS, and an end user.
    Free
    Add to Wishlist
    Download
    AI Customize
    Colorful Venn diagram infographic illustrating key components of Big Data with associated methods and icons.
    Add to Wishlist
    Download
    AI Customize
    Slide deck with a dark theme, featuring a glowing network sphere and blue highlights, about big data concepts.
    Add to Wishlist
    Download
    AI Customize
    Infographic with six colorful blocks connected to a central grey column, listing big data advantages.
    Add to Wishlist
    Download
    AI Customize
    Data collection template with colored oval labels listing methods such as review records, weighting, case study, and more.
    Add to Wishlist
    Download
    AI Customize
    Illustration of a database and servers in a yellow box, with four numbered points placed around it.
    Add to Wishlist
    Download
    AI Customize
    Illustration of three data servers with colored panels, and numbered caption boxes on the right, on a blue background.
    Add to Wishlist
    Download
    AI Customize
    Illustration of women with large data visualizations on the left and placeholder text explaining the benefits.
    Add to Wishlist
    Download
    AI Customize
    Database PowerPoint Template For Presentation
    Add to Wishlist
    Download
    AI Customize
    Data center slide with server icon above three pie charts labeled with captions below.
    Add to Wishlist
    Download
    AI Customize
    3D layered data visualization with business people interacting, laptops on top, and numbered text sections on the side.
    Add to Wishlist
    Download
    AI Customize
    Infographic illustrating the four key dimensions of Big Data with associated definitions and icons.
    Add to Wishlist
    Download
    AI Customize
    Big data architecture diagram showing a flow from data ingestion, staging, and access to insights, with components.
    Free
    Add to Wishlist
    Download
    AI Customize
    Three stacked cylinder diagrams in green and purple, connected by arrows to a central circle, set against a gray background.
    Add to Wishlist
    Download
    AI Customize
    Big data-related slide with four icons and progress bars on the left, and a percentage-based bar graph on the right.
    Add to Wishlist
    Download
    AI Customize
    Three teal outlined rectangular boxes featuring data visualization illustations in blue theme and bullet points below.
    Add to Wishlist
    Download
    AI Customize
    A teal server icon at the top with yellow and pink details, connected to three pie charts labeled below.
    Add to Wishlist
    Download
    AI Customize
    Folder icon with a magnifying glass on the left, alongside four numbered circles with descriptions in a beige theme.