MILESTONE 🌟 5 Million+ creative minds trust SlideEgg! Grab 80% OFF

Business Analytics PowerPoint for Data-Driven Decisions

Business analytics slide featuring icons for goal setting and data analysis with a circular image of a laptop and hands.
P.ID : 11745
    207 views
    7 Downloads
    Get Custom Slides by Experts
    Instantly Access Templates in PowerPoint

    Business Analytics PowerPoint Template and Google Slides


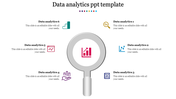
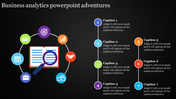
    This template features two sections, each containing a distinct colored icon and a caption box. This layout provides a clear and concise way to showcase key concepts in business analytics or highlight two key findings from your data analysis.

    This template is a valuable tool for business analysts, marketing professionals, sales representatives, or anyone who needs to communicate data-driven insights or business analytics concepts in a clear and visually engaging way.


    Features of this template:


    • 100 % customizable slides are easy to download. 
    • Slides are available in different nodes and colors.
    • The slide was contained in 16:9 and 4:3 formats.
    • It is easy to change the slide colors quickly.
    • Well-crafted template with an instant download facility.
    • The clear layout of this template will help you design a professional-looking presentation.
    • The multi-color visuals on this slide will make your presentation eye-catching.
    Advertisement

    You May Also Like These PowerPoint Templates

    Free
    Add to Wishlist
    Download
    AI Customize
    Three vertical capsule shaped charts in pink, gray, and red on a dark background, with a large orange arrow at the bottom.
    Add to Wishlist
    Download
    AI Customize
    Growth analysis PowerPoint template with four steps and a computer showing bar chart analysis.
    Add to Wishlist
    Download
    AI Customize
    Infographic design featuring a magnifying glass lens divided into four quadrants, each representing a type of analysis.
    Add to Wishlist
    Download
    AI Customize
    Root cause analysis slide with a tree diagram and four labeled colored boxes on branches, with three captions at the bottom.
    Free
    Add to Wishlist
    Download
    AI Customize
    Map-based analysis design with statistical data visuals including circular graphs and demographic distributions.
    Add to Wishlist
    Download
    AI Customize
    Circular infographic with a central globe icon connected to eight color-coded nodes for analytics techniques.
    Free
    Add to Wishlist
    Download
    AI Customize
    Colorful radial design with six segments around a red analysis icon, highlighting key analytics strategies.
    Add to Wishlist
    Download
    AI Customize
    Five colorful oval shapes in blue, green, red, orange, and teal, with shadow effects, featuring icons and captions inside.
    Add to Wishlist
    Download
    AI Customize
    Side-by-side Pareto analysis blocks with 20% and 80% sections, representing complaints and reasons in contrasting colors.
    Add to Wishlist
    Download
    AI Customize
    Capabilities analysis template featuring color coded categories on the left and a circular percentage chart on the right.
    Add to Wishlist
    Download
    AI Customize
    Circular diagram with four segments in yellow, green, blue, and teal, each containing icons around a white central circle.
    Add to Wishlist
    Download
    AI Customize
    Use Performance PowerPoint And Google Slides Template
    Add to Wishlist
    Download
    AI Customize
    Illustration of a woman analyzing colorful bar and pie charts, with three color coded circular icons on the right.
    Add to Wishlist
    Download
    AI Customize
    Five numbered interconnected puzzle pieces in red, green, purple, teal, and blue, with human illustrations above.
    Add to Wishlist
    Download
    AI Customize
    Vibrant PESTLE chart dividing political, economic, social, technological, legal, and environmental aspects.
    Add to Wishlist
    Download
    AI Customize
    Analysis template with a man looking through a magnifying glass at a computer screen with four types and caption areas.