Year In Review PPT Template Presentation & Google Slides

Year-in-review slide showcasing job losses via a bar chart alongside a map comparing job loss in the US and other countries.
P.ID : 61996
    710 views
    31 Downloads
    Get Custom Slides by Experts
    Instantly Access Templates in PowerPoint

    Year In Review Presentation Slide

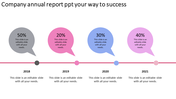
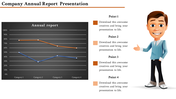
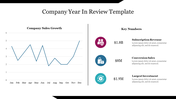
    A "Year in Review" is a summary of the past 12 months, highlighting significant events, achievements, challenges, profit, and losses. It's an opportunity to reflect on accomplishments, learnings, and growth throughout the year. People usually showcase a "Year in Review" to share with potential clients and partners. Our "Year in Review" template is a pre-designed format that makes it easier to organize and present your year in review about job losses in the US compared with other countries. It has perfect visuals to help you present your thoughts. So, be benefitted now!

    Features of this template

    • 100% customizable slides and easy to download.
    • Slides are available in different nodes & colors.
    • The slides contained 16:9 and 4:3 format.
    • Easy to change the slide colors quickly.
    • Well-crafted template with instant download facility.
    • One of the best templates from Slide Egg.
    • Adaptive in PowerPoint and Google Slides.
    • Huge Collections of slides to impress your audience.
    Advertisement

    You May Also Like These PowerPoint Templates

    Add to Wishlist
    Download
    AI Customize
    Annual report slide with financial data table in red and gray layout, and a venn diagram showing percentages.
    Add to Wishlist
    Download
    AI Customize
    Annual report template with an orange theme, featuring financial data, milestones, team profiles, and company history.
    Free
    Add to Wishlist
    Download
    AI Customize
    Business review PowerPoint slide featuring icons for steps, with captions and a lightbulb icon.
    Add to Wishlist
    Download
    AI Customize
    Weekly planner table with colorful bars indicating tasks for each month from January to June with placeholder text.
    Add to Wishlist
    Download
    AI Customize
    Timeline of weekly project report submissions across four months, using color-coded bars to different report durations.
    Add to Wishlist
    Download
    AI Customize
    An infographic slide showing survey results with a pie chart and percentages for 2016, 2017, and 2018, each with icons.
    Add to Wishlist
    Download
    AI Customize
    Report PowerPoint template showing a workspace with a laptop, clipboard, and stationery on a geometric patterned background.
    Free
    Add to Wishlist
    Download
    AI Customize
    Annual sales template with a green pie chart, a cartoon character pointing to it, and space for headings and descriptions.
    Add to Wishlist
    Download
    AI Customize
    Business report PPT with bar and pie charts including sales by location, units per transaction, and customer retention rate.
    Add to Wishlist
    Download
    AI Customize
    Status report table with five phases, colored lines connecting points, and text rows on a gray and white grid background.
    Add to Wishlist
    Download
    AI Customize
    2019 annual report slide design with brown and orange geometric shapes and a building image in the layout.
    Add to Wishlist
    Download
    AI Customize
    Colorful weekly schedule PowerPoint slide with time slots for each day of the week.
    Free
    Add to Wishlist
    Download
    AI Customize
    Annual report slide with a timeline for 2017 to 2019, featuring speech bubbles in gray, pink, and blue, showing percentages.
    Add to Wishlist
    Download
    AI Customize
    Financial report template with slides covering company statements,  analysis, supervisory board reports, and team profiles.
    Add to Wishlist
    Download
    AI Customize
    Company annual report slide with a gray and red graph displaying data with percentage values for investment and profit.
    Free
    Add to Wishlist
    Download
    AI Customize
    Annual report slide displaying a sales bar chart, an rate donut chart, anrevenue line graph, and an growth bar chart.
    Add to Wishlist
    Download
    AI Customize
    Slide with a revenue chart and metrics for daily, weekly, and yearly sales, along with three user graphs.