MILESTONE 🌟 5 Million+ creative minds trust SlideEgg! Grab 80% OFF

Preventive Maintenance Vs Predictive Maintenance PowerPoint

Pack of 11 slides
P.ID : 75516
Advertisement
1 views
1 Downloads
Get Custom Slides by Experts
Enhance Your Presentations with Add-ins
Google Slides Add-in
Access templates directly in Google Slides
Microsoft PowerPoint Add-in
Access templates directly in PowerPoint
GPT Add-on
AI-powered presentation assistance

Preventive Maintenance Vs Predictive Maintenance PPT, Google Slides, And Canva Template


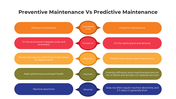
Preventive Maintenance vs Predictive Maintenance helps us understand two key strategies used to avoid equipment failure and downtime. While preventive maintenance is time-based, predictive maintenance uses data and sensors to anticipate issues before they occur.

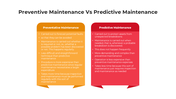
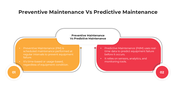
This PowerPoint template features vibrant colors like orange, red, yellow, and navy blue, paired with clean comparison layouts and icon-based visuals. It clearly distinguishes both methods using split columns, arrows, and bullet points that make the topic easy to present and understand.

This template is designed to explain the core differences between preventive and predictive maintenance in an engaging way. It supports training discussions with questions like: What is the main difference between these two methods? (Time-based vs condition-based) and Which is more efficient? (Depends on system and cost). The slides are informative, well-structured, and visually clear.

Maintenance teams, plant supervisors, engineering students, trainers, and operations managers can use this template in workshops, technical classes, or meetings. It is ideal for simplifying a complex subject into practical learning.


Download this Preventive vs Predictive Maintenance template now and bring clarity to your next maintenance or training presentation with real-world relevance and visual impact.


Features of this template


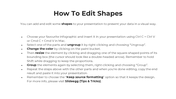
  • 100% customizable slides and easy to download.
  • The slides contain 16:9 and 4:3 formats.
  • Easy to change the colors quickly.
  • Highly compatible with PowerPoint, Google Slides, and Canva templates.

You May Also Like These PowerPoint Templates

Add to Wishlist
Download
AI Customize
Product comparison table slide with a green section highlighting advantages and a red section showing disadvantages.
Add to Wishlist
Download
AI Customize
Comparison PPT slide featuring colorful icons of people with different percentages, illustrating a gender based comparison.
Add to Wishlist
Download
AI Customize
A PowerPoint slide comparing two IT services managed services and vDoctor, with key features and benefits highlighted.
Add to Wishlist
Download
AI Customize
Cause and effect PowerPoint slide with three rows of paired text boxes and icons in orange, blue, and red colors.
Add to Wishlist
Download
AI Customize
Gender symbols chart slide with two sections displaying groups of male and female icons, each with percentage markers.
Add to Wishlist
Download
AI Customize
Comparison diagram showing the connection between logistics 4.0 and industry 4.0, with shared elements in the center.
Free
Add to Wishlist
Download
AI Customize
Comparison slide with male icon in Circle A and female icon in Circle B, flanked by steps 01 and 02 on both sides.
Add to Wishlist
Download
AI Customize
Structured chart comparing blockchain types using gold bordered boxes and bullet points for detailed characteristics.
Add to Wishlist
Download
AI Customize
Comparison slide with two interlocked triangles in orange and blue, paired with captions on both sides.
Add to Wishlist
Download
AI Customize
Force field template with driving and restricting forces each with a colored box and placeholder text areas.
Add to Wishlist
Download
AI Customize
Structured layout featuring four rows of paired colored circles and corresponding gray text boxes on a white background.
Free
Add to Wishlist
Download
AI Customize
A split layout with green and white, each displaying a bar chart, with icons and text below.
Free
Add to Wishlist
Download
AI Customize
Creative ideas slide featuring two brain illustrations on blue scale base, highlighting balance between seeing and thinking.
Add to Wishlist
Download
AI Customize
Cause and effect diagram with two large arrows in red and blue, each linked to icons in colored boxes.
Add to Wishlist
Download
AI Customize
Slide with comparative icons and percentage values in circular designs for various templates, with placeholder text areas.
Add to Wishlist
Download
AI Customize
Demographic comparison slide with red male and blue female icon, with percentage values and text areas below each.
Add to Wishlist
Download
AI Customize
Pricing comparison table with four columns for silver, gold, diamond, and platinum plans, each showing a monthly price.