Gap Analysis Process PowerPoint Template and Google Slides

Process flow chart with blue squares linked by arrows, showing a transition from input elements to output.
P.ID : 36018
    13 slides
    Slide deck on gap analysis with colorful infographics, circular diagrams, and segmented categories for business insights.
    16 slides
    A pack of gap analysis overview slides displaying various colorful design layouts with text descriptions.
    14 slides
    A pack of fit gap analysis slides displaying four main categories in different colorful layout designs with icons and text.
    663 views
    16 Downloads
    Get Custom Slides by Experts
    Instantly Access Templates in PowerPoint

    Gap Analysis Process Presentation Template


    Are you striving to reach your goals but finding obstacles in your way? Our Gap Analysis Process template is here to help! This straightforward tool breaks down the steps to identify and tackle the differences between where you are now and where you want to be.
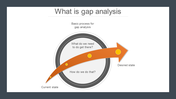
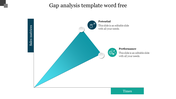
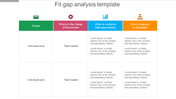
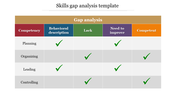
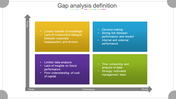
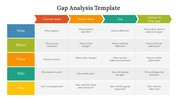
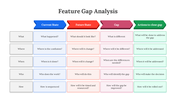
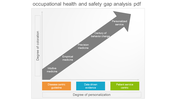
    Visual Clarity:

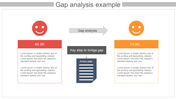
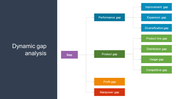
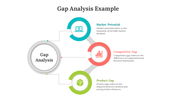
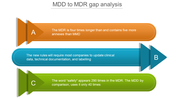
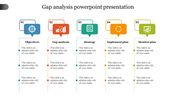
    Our template uses easy-to-understand visuals: boxes show key stages, and arrows guide you through each step. This visual approach makes it simple to follow the flow of information—from pinpointing your current situation to defining your target outcome and crafting effective strategies.

    Empowering Users:


    Whether you’re a business leader, a project manager, or a student, this template empowers you to conduct thorough gap analyses. Discover areas for improvement and develop actionable plans with confidence.

    Customization and Action:

    Customize the template with your data, and present your findings. Download our template today and take the first step toward achieving tangible results!

    Features of the template


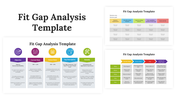
    • Slides are available in different nodes & colors.
    • Easy to change the slide colors.
    • Well-crafted template with instant download.
    • Highly compatible with PowerPoint and Google Slides.
    Advertisement

    You May Also Like These PowerPoint Templates

    Add to Wishlist
    Download
    AI Customize
    White circle with orange and blue gender icons, linked to three text boxes with green, red, and orange circular edges.
    Add to Wishlist
    Download
    AI Customize
    Graph showing skills gap analysis with increasing revenue over time, mapping potential performance and associated risks.
    Add to Wishlist
    Download
    AI Customize
    Service gap analysis model with customer perceptions and expectations, connected to service delivery and standards.
    Add to Wishlist
    Download
    AI Customize
    Data analysis slide featuring a table with rows and columns with colored headers and green check marks.
    Add to Wishlist
    Download
    AI Customize
    Gap analysis slide in banking represented by a five point diagram with icons covering the financial sector to transparency.
    Add to Wishlist
    Download
    AI Customize
    Orange circular design linked to five colored text sections in blue, yellow, green, red, and purple on the right.
    Add to Wishlist
    Download
    AI Customize
    Flowchart for gap analysis linking service perception to quality, customer satisfaction, and loyalty.
    Add to Wishlist
    Download
    AI Customize
    Gap analysis slide with a circular diagram in the center and four horizontal, color coded sections with icons and captions.
    Add to Wishlist
    Download
    AI Customize
    The Gap Analysis PPT Download Presentation For You
    Add to Wishlist
    Download
    AI Customize
    Two column layout with four colored icons and analysis types, linked by text in the center.
    Free
    Add to Wishlist
    Download
    AI Customize
    Gap analysis diagram with a triangle indicating the area, placed between labeled axes and surrounded by placeholder text.
    Add to Wishlist
    Download
    AI Customize
    Get Affordable Cost Gap Analysis Template Themes Design
    Add to Wishlist
    Download
    AI Customize
    Graph illustrating a gap analysis with potential and performance metrics plotted against time with placeholder text.
    Add to Wishlist
    Download
    AI Customize
    Training gap analysis table with questions on safety policies, answers, and implementation status columns.
    Add to Wishlist
    Download
    AI Customize
    A blue bordered circle with a green graph, and a text section, all set on a light background.
    Add to Wishlist
    Download
    AI Customize
    Table with colorful headers in blue, red, green, yellow, purple, gray, and orange, with rows of gray text filled cells.