Best Effective Ways To Analysis PowerPoint Template

Effective ways to analysis PPT slide with options Job, Semen, and Data, each represented by grey icons and descriptive text.
P.ID : 27389
    11 slides
    Slide deck outlining the change readiness assessment process, with four color coded phases and corresponding steps.
    9 slides
    Four horizontal banners in purple, yellow, blue, and red listing steps for research ethics, placed on a white background.
    13 slides
    Content Analysis PowerPoint And Google Slides Themes
    11 slides
    Organizational assessment slide deck highlighting mission at the center, surrounded by four elements with level indicators.
    92 views
    1 Downloads
    Get Custom Slides by Experts
    Instantly Access Templates in PowerPoint

    Effective Ways To Analysis Presentation Template


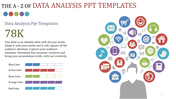
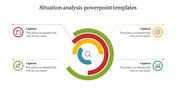
    In today’s data-driven world, understanding and communicating data insights is crucial. Our Effective Ways to Analysis PowerPoint template offers a comprehensive solution to showcase your analytical findings clearly and compellingly.

    Slide Description:

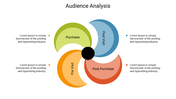
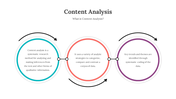
    Our slide features three oval shapes and icons named Job, Semen, and Data each has a placeholder text.

    Purpose of this slide:

    To present information related to three different topics: job, semen (or a similar term), and data. By using icons and concise text, the template aims to visually categorize and convey key points.

    Who can benefit?

    Professionals, researchers, or anyone needing to present analysis results could benefit from this template. It provides a structured format for sharing insights or findings in areas such as business, research, or data management.

    What is called analysis?

    To study (something) closely and carefully

    Download our templates to elevate your presentations. 

    Features of the template:


    •  Slides are available in 4:3 & 16:9
    • Get slides that are 100% customizable and easy to download
    • Highly compatible with PowerPoint and Google Slides
    Advertisement

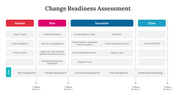
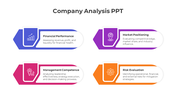
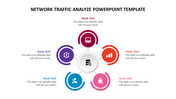
    You May Also Like These PowerPoint Templates

    Add to Wishlist
    Download
    AI Customize
    A colorful table with five columns and multiple rows, filled with numbers and text areas under colorful headers.
    Add to Wishlist
    Download
    AI Customize
    Category analysis slide featuring six colored boxes each with bullet points.
    Add to Wishlist
    Download
    AI Customize
    Customer analytics slide deck with five diamond icons representing steps from customer experience to data collection.
    Add to Wishlist
    Download
    AI Customize
    Slide with two columns in red and blue, each with three rectangular boxes, connected to a central circular icon.
    Add to Wishlist
    Download
    AI Customize
    Two figures connected by curved orange arrows leading to two segmented groups of people in blue and gray.
    Add to Wishlist
    Download
    AI Customize
    Data gap analysis chart with colored horizontal arrows labeled current state, desired state, gap, and mitigation.
    Add to Wishlist
    Download
    AI Customize
    Semi circular infographic in red, orange, yellow, and blue segments displaying performance factors with details.
    Add to Wishlist
    Download
    AI Customize
    Slide with a central book icon surrounded by four diamonds in yellow, red, green, and purple, each with icon and text area.
    Add to Wishlist
    Download
    AI Customize
    Core competencies analysis table with numbered steps and corresponding actions for identifying and developing competencies.
    Add to Wishlist
    Download
    AI Customize
    Investigative journalism template featuring a magnifying glass on a laptop keyboard, with placeholder text areas.
    Add to Wishlist
    Download
    AI Customize
    Analytics slide showcasing industrial buildings and two progress bars highlighting techniques with corresponding percentages.
    Add to Wishlist
    Download
    AI Customize
    Customer Profitability Analysis PPT And Google Slides
    Add to Wishlist
    Download
    AI Customize
    Financial analysis slide with six green arrows pointing to a central diamond featuring a cash and coins graphic.
    Add to Wishlist
    Download
    AI Customize
    Slide featuring a cost benefit analysis table, displaying types descriptions alongside an image of hands holding cash.
    Add to Wishlist
    Download
    AI Customize
    Four blue and white sections for web analytics uses, featuring icons and text placeholders.
    Add to Wishlist
    Download
    AI Customize
    Project prioritization using the Moscow technique, with four sections with placeholder text.
    Add to Wishlist
    Download
    AI Customize
    Four colored books stacked vertically, with corresponding progress bars and icons on the right showing percentages.
    Add to Wishlist
    Download
    AI Customize
    Business analysis layout with three numbered hexagon steps and a photo of a business meeting on a dark blue background.