Amazing Comparison Presentation Template Slide PPT

Comparison presentation slide with two options, featuring check and cross icons to show differences between items.
P.ID : 66033
    387 views
    58 Downloads
    Get Custom Slides by Experts
    Instantly Access Templates in PowerPoint

    Amazing Comparison Presentation Template Slide PPT

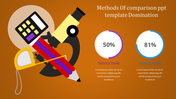
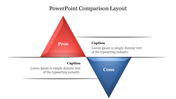
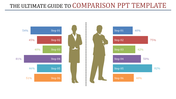
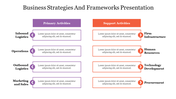
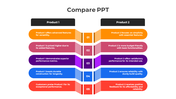
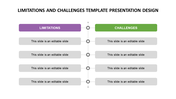
    Extraordinary Comparison Presentation Ideas Design Template for Slides is a must to download if you are framing a PPT. The template is designed with attractive colorful boxes to bring a subtle look to the PPT. You can Provide your ideas for comparison in the given column in the center.
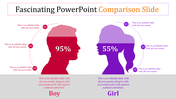
    Nothing compares to a detailed chart to show your quantitative results to your audience! This free Comparative Bar Charts template offers a perfect design to share your numbers and percentages and make comparisons.


    About the template

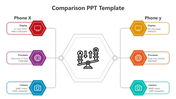
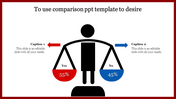
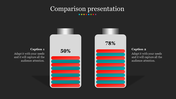
    Nothing compares to a clear Comparison Presentation to show your quantitative results to your audience! This Comparison PowerPoint Presentation offers a perfect design to share your numbers and percentages and make comparisons. In the middle of this PPT stands a white column where you can write items you would like to compare and produce the results. This template is a simple and easy-to-read option to share and compare quantitative results. A perfect tool for Data Analysis!

    Features Of This Template:

    1. 100% customizable slides and easy to download.
    2. Slides available in different nodes & colors.
    3.The slide contained 16:9 and 4:3 format.
    4.Easy to change the slide colors quickly.
    5.Well-crafted template with instant download facility.
    6.One of the best templates from SlideEgg.
    7.Crisp and clear font styles.
    Advertisement

    You May Also Like These PowerPoint Templates

    Free
    Add to Wishlist
    Download
    AI Customize
    Green circular sections connected to a central icon, with three numbered circles on both sides and text.
    Free
    Add to Wishlist
    Download
    AI Customize
    Red cause-and-effect layout with wavy lines connecting two columns, each having three sections, with placeholder text.
    Free
    Add to Wishlist
    Download
    AI Customize
    Orange themed cause and effect diagram PowerPoint template with circular steps connected to a central node.
    Add to Wishlist
    Download
    AI Customize
    A comparison template with four numbered sections  arranged vertically in the center, with colored placeholder text boxes.
    Add to Wishlist
    Download
    AI Customize
    Scales comparison infographic showing a person holding balanced options with labels and percentages.
    Add to Wishlist
    Download
    AI Customize
    Colorful venn diagram slides comparing data and information showing differences between data and info in different layouts.
    Add to Wishlist
    Download
    AI Customize
    Cause and effect diagram with two large arrows in red and blue, each linked to icons in colored boxes.
    Free
    Add to Wishlist
    Download
    AI Customize
    Comparison slide featuring business vs marketing with blue and yellow team icons and placeholder text areas.
    Add to Wishlist
    Download
    AI Customize
    Comparison chart PPT template with side by side horizontal bar charts showing percentages, each paired with an icon.
    Free
    Add to Wishlist
    Download
    AI Customize
    Comparison slide for PowerPoint showing progress percentages for four steps with icons of a man and a woman.
    Free
    Add to Wishlist
    Download
    AI Customize
    Cause and effect slide with purple circular sections, icons, and connecting arrows, divided into three steps.
    Add to Wishlist
    Download
    AI Customize
    Comparison chart design featuring three hexagonal shapes labeled Project Name 01, 02, and 03, with colorful outlines.
    Add to Wishlist
    Download
    AI Customize
    Comparison infographic with two sections divided by a vertical line, each with colored caption areas for analysis.
    Free
    Add to Wishlist
    Download
    AI Customize
    Green themed cause and effect PPT slide diagram with a circular center and six connected placeholder text boxes.
    Free
    Add to Wishlist
    Download
    AI Customize
    A slide comparing two results with hourglass icons, showing a percentage breakdown with a man presenting the comparison.