Analytics PowerPoint Template Presentation Slide

 Canva
Canva
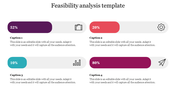

Analytics PowerPoint Template
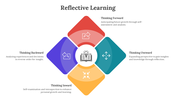
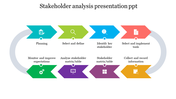
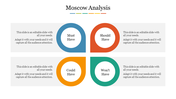
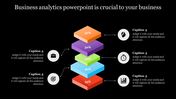
Unveiling our analytics PowerPoint template, crafted to showcase teamwork, diversity, and innovation in your analytical projects. The template presents a diverse group of people standing in a circle, resembling a business meeting or training session focused on analytics and data-driven insights.
Drenched in vibrant shades of blue, red, and yellow, the color palette amplifies the lively nature of the discussion, creating an atmosphere of energy and creativity within the team. This visual representation underscores the collaborative essence of analytics, where various perspectives and expertise come together to drive well-informed decision-making.
Whether you're sharing data analysis findings, exploring strategic insights, or guiding training sessions on analytics tools and methods, our template offers a captivating visual background that captivates your audience and emphasizes the significance of teamwork in achieving success in analytics.
Take your analytics presentations to new heights with our template and encourage your audience to embrace collaboration and innovation in their data-driven pursuits.
Features of the template
- 100% customizable slides and easy to download.
- Slides are available in different nodes & colors.
- The slide contains 16:9 and 4:3 formats.
- It is easy to change the colors of the slide quickly.
- Well-crafted template with an instant download facility.


You May Also Like These PowerPoint Templates


