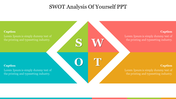
Infographic SWOT Analysis Template Presentation

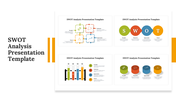
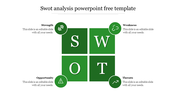
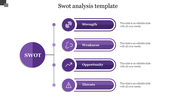
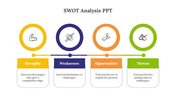
SWOT Analysis Presentation Template
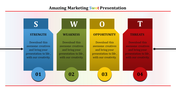
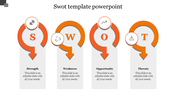
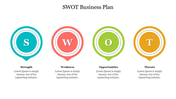
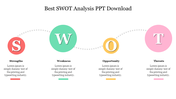
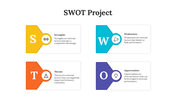
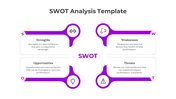
Make use of our SWOT Analysis Presentation Template to deliver your audience with the best outputs. The slide comes with a professional color backdrop. Info graphics are given in the form of zigzag curves. Icons representing growth and strength are given. Captions and describing the SWOT terms are available with customizable qualities.
Percentage values are also available to provide precise data to the audience. Perfect template for marketing professionals, business strategists, decision makers. Suitable for assessing market trends, evaluating campaigns, and strategizing for the future. Download our template to create visible results from your info graphic data.
Features of the template
- 100% customizable slides and easy to download.
- Slides are available in different nodes & colors.
- The slide contains 16:9 and 4:3 formats.
- It is easy to change the colors of the slide quickly.
- Well-crafted template with an instant download facility.


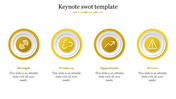
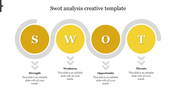
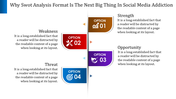
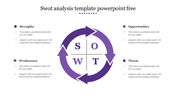
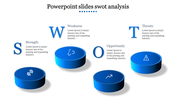
You May Also Like These PowerPoint Templates
Add to Wishlist
Download
Edit

Add to Wishlist
Download
Edit

Add to Wishlist
Download
Edit

Add to Wishlist
Download
Edit


Add to Wishlist
Download
Edit

Add to Wishlist
Download
Edit

Add to Wishlist
Download
Edit

Add to Wishlist
Download
Edit

Add to Wishlist
Download
Edit

Add to Wishlist
Download
Edit

Add to Wishlist
Download
Edit

Add to Wishlist
Download
Edit

Add to Wishlist
Download
Edit

Add to Wishlist
Download
Edit

Add to Wishlist
Download
Edit

Add to Wishlist
Download
Edit

Add to Wishlist
Download
Edit

Add to Wishlist
Download
Edit
