Get Servqual Model Diagram PowerPoint And Google Slides

A colourful flowchart diagram of the SERVQUAL model showing from management perceptions up to customer communication.
P.ID : 71424
    70 views
    7 Downloads
    Get Custom Slides by Experts
    Instantly Access Templates in PowerPoint

    Servqual Model Diagram Presentation Slide


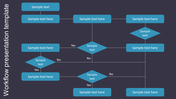
    The Servqual Model Diagram is a visual encapsulation of the renowned framework for evaluating service quality, spotlighting the service quality gap diagram integral to the model. Through a harmonious blend of 'service' and 'quality', the model vividly highlights the disparities between customer expectations and actual experiences. Central to this is the Servqual model gap analysis diagram that accentuates five key dimensions – tangibles, reliability, responsiveness, assurance, and empathy. This graphic representation isn't just informative; it provides a roadmap for businesses to bridge service gaps, ensuring they reach pinnacle service delivery. Perfectly tailored for service managers and customer experience professionals, the template translates these abstract concepts into an engaging visual narrative. By navigating this model, presenters and audiences alike are equipped with insights to redefine and elevate their service standards in the ever-evolving market landscape.


    Features of the templates:


    • 100% customizable slides and easy to download.
    • Slides are available in different nodes & colors.
    • The slide contained 16:9 and 4:3 formats.
    • Easy to change the slide colors quickly.
    • It is a well-crafted template with an instant download facility.
    • Highly compatible with PowerPoint and Google Slides.
    Advertisement

    You May Also Like These PowerPoint Templates

    Add to Wishlist
    Download
    AI Customize
    Creative Fluxogram PowerPoint Template For Presentation
    Add to Wishlist
    Download
    AI Customize
    Duplication reduction flowchart outlining steps from input data through duplicate, non-duplicate, and data storage.
    Add to Wishlist
    Download
    AI Customize
    Hoshin kanri template with a process flow diagram on a blue background, showcasing key steps in strategic planning.
    Add to Wishlist
    Download
    AI Customize
    Microsoft flowchart layout showing process flow with central and connecting rectangular boxes.
    Add to Wishlist
    Download
    AI Customize
    Flow chart diagram slide illustrating a process with three nodes and decision points, labeled with captions.
    Add to Wishlist
    Download
    AI Customize
    Colorful flowchart diagram in various shapes and arrows showing a step-by-step process, set with a caption area in each box.
    Add to Wishlist
    Download
    AI Customize
    Business flowchart with interconnected colorful rectangular boxes, each with an icon, laid out in a hierarchical structure.
    Free
    Add to Wishlist
    Download
    AI Customize
    Visual representation of a process flow between users, libraries, and a master, with color-coded text bubbles and textbox.
    Add to Wishlist
    Download
    AI Customize
    Diagram illustrating use case template for generating reports, summaries, and exporting files.
    Free
    Add to Wishlist
    Download
    AI Customize
    Circular flowchart with six colorful segments connected around a central circle, each with an icon and captions.
    Add to Wishlist
    Download
    AI Customize
    Work breakdown structure diagram with two phases, each with multiple deliverables and work packages arranged in a hierarchy.
    Add to Wishlist
    Download
    AI Customize
    Stunning Empty Flow Chart PowerPoint Presentation Slide
    Add to Wishlist
    Download
    AI Customize
    Organizational flowchart showing CEO Anthony leading the team, with VP Boris and Production Manager Sheila and employees.
    Add to Wishlist
    Download
    AI Customize
    Grayscale diagram with rectangles, arrows, and cylinders connected in a flowchart illustrating Jenkins integration.
    Add to Wishlist
    Download
    AI Customize
    Workflow diagram with six numbered circular nodes connected by curved orange lines on a blue background with glowing accents.
    Add to Wishlist
    Download
    AI Customize
    Flowchart showing a construction quality control process with steps in blue and orange boxes connected by arrows.
    Add to Wishlist
    Download
    AI Customize
    Slide deck showcasing various colorful flowchart designs with interconnected shapes and labeled sections.