Informative SEO Vs SEM PowerPoint And Google Slides

 Canva
Canva
SEO Vs SEM PPT, Google Slides, And Canva Template
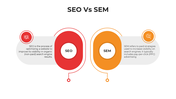
In digital marketing, SEO (Search Engine Optimization) and SEM (Search Engine Marketing) are two powerful approaches — but many confuse them. SEO focuses on improving a website’s visibility through unpaid, organic search results, while SEM uses paid strategies like pay-per-click (PPC) advertising to drive immediate visibility.
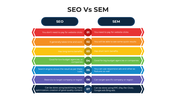
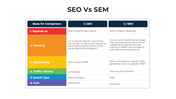
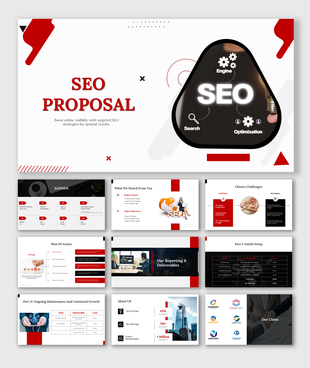
The SEO Vs SEM PowerPoint Template makes these differences crystal clear. With color-coded infographics, side-by-side comparisons, and easy-to-read charts, this template simplifies complex concepts into visuals that anyone can understand.
It is designed for marketers, trainers, educators, students, and business professionals who want to explain how SEO fosters long-term growth and trust, while SEM delivers faster but more costly results. The slides also highlight the benefits, limitations, and best use cases of both strategies, providing your audience with a balanced view.
The bold red and orange theme visually separates SEO and SEM for quick clarity, making your presentation not only informative but also visually engaging.
By using this template, you can help your audience make better marketing decisions, understand budget allocation, and create stronger digital strategies.
Features of this template
- 100% customizable slides and easy to download.
- The slides contain 16:9 and 4:3 formats.
- Easy to change the colors quickly.
- Highly compatible with PowerPoint, Google Slides, and Canva templates.










You May Also Like These PowerPoint Templates

Showing36 of69,218 templates