Free - Enrich your Sales Performance Presentation Format PPT
Free


Sales Performance Templates and Google Slides
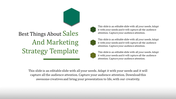
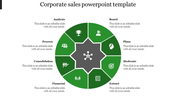
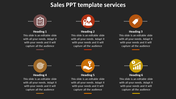
Crafting a compelling sales performance presentation format is crucial for effective communication in business. Employing a flower design with six nodes adds a touch of creativity and visual appeal, enhancing engagement. Professional shades of colors elevate the overall aesthetic, creating a visually appealing backdrop. The key performance indicators (KPIs) are seamlessly integrated into the presentation, offering a clear and concise overview of crucial metrics. This design not only captivates the audience but also facilitates a comprehensive understanding of sales performance, making it an ideal choice for impactful business presentations.
Feature of the template
- 100% customizable slides and easy to download.
- Slides available in different nodes & colors.
- The slide is contained in 16:9 and 4:3 format.
- Easy to change the slide colors quickly.
- Well-crafted template with instant download facility.


You May Also Like These PowerPoint Templates
Add to Wishlist
Download
Edit


Add to Wishlist
Download
Edit

Add to Wishlist
Download
Edit


Add to Wishlist
Download
Edit


Add to Wishlist
Download
Edit

Add to Wishlist
Download
Edit

Add to Wishlist
Download
Edit

Add to Wishlist
Download
Edit

Add to Wishlist
Download
Edit


Add to Wishlist
Download
Edit

Add to Wishlist
Download
Edit

Add to Wishlist
Download
Edit

Add to Wishlist
Download
Edit

Add to Wishlist
Download
Edit

Add to Wishlist
Download
Edit
