Quarterly Projections PowerPoint And Google Slides

 Canva
Canva
Quarterly Projections PPT, Google Slides, and Canva Template
Quarterly projections are an essential part of financial planning, offering a snapshot of a company’s expected performance over three months. They typically include estimates of revenue, expenses, profits, and cash flow, helping businesses forecast their financial health and make informed decisions. By analyzing past performance and market trends, quarterly projections enable businesses to adapt to market changes, optimize resource allocation, and meet financial goals.
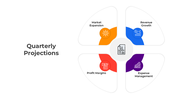
Purpose Of The Slides
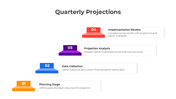
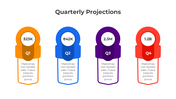
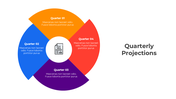
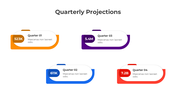
This Quarterly Projections PPT template is designed to simplify the process of creating and presenting financial projections. Whether you're a business professional, student, or financial analyst, this template will guide you in showcasing key projections, identifying trends, and tracking progress. It covers all essential aspects, from sales forecasts to expense management, ensuring clarity in every projection.
Who Can Use It?
- Business Professionals: Use the template to present quarterly financial forecasts to stakeholders or clients.
- Students: Learn how to create and interpret quarterly projections for academic or real-world applications.
- Financial Analysts: Improve your ability to make accurate financial forecasts for businesses or investment purposes.
Special Key Features
This 11-slide template is fully customizable, with a multicolor theme to enhance your presentation. Each slide is easy to adjust, allowing you to include key data and projections tailored to your specific needs.
Download the Quarterly Projections template today and start creating professional, impactful presentations that drive business decisions and financial success!
Features of this template
- 100% customizable slides and easy to download.
- The slides contain 16:9 and 4:3 formats.
- It is easy to change the colors quickly.
- Highly compatible with PowerPoint, Google Slides, and Canva templates.


You May Also Like These PowerPoint Templates

Add to Wishlist
Download
Edit

Add to Wishlist
Download
Edit

Add to Wishlist
Download
Edit

Add to Wishlist
Download
Edit

Add to Wishlist
Download
Edit


Add to Wishlist
Download
Edit

Add to Wishlist
Download
Edit

Add to Wishlist
Download
Edit

Add to Wishlist
Download
Edit

Add to Wishlist
Download
Edit

Add to Wishlist
Download
Edit

Add to Wishlist
Download
Edit

Add to Wishlist
Download
Edit


Add to Wishlist
Download
Edit

Add to Wishlist
Download
Edit

Add to Wishlist
Download
Edit

Add to Wishlist
Download
Edit
