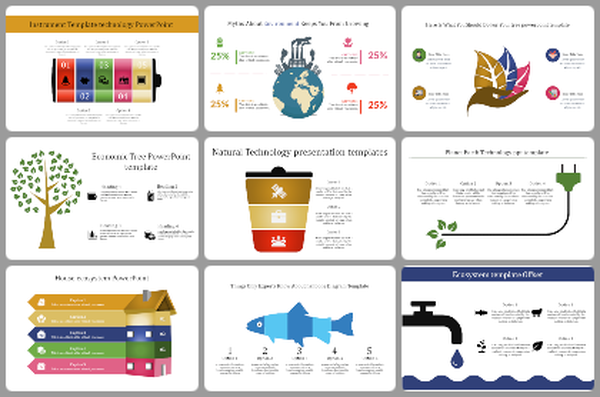
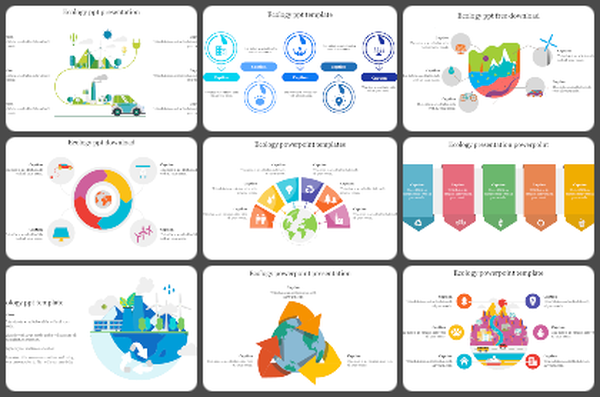
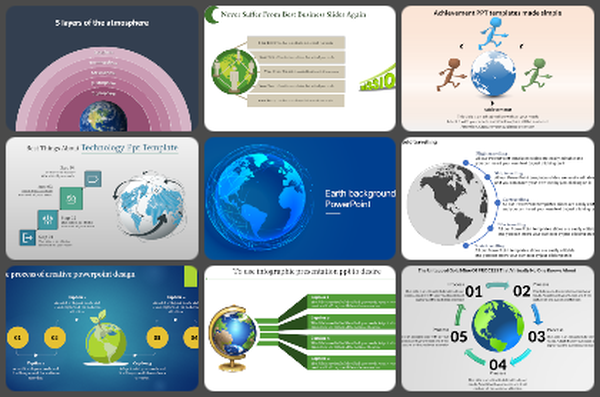
Pollution Infographic Slide for PowerPoint 4 Sector Diagram

 Canva
Canva
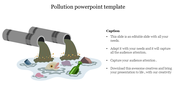
Pollution PPT Infographic Slide for PowerPoint (4-Sector Diagram)
Visualize Environmental Impact Data in a Single Slide
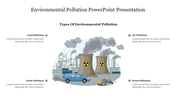
Creating a high-impact diagram for an Environmental Science project usually takes hours of design time. We have done the heavy lifting for you. This Pollution Infographic Slide is a professional, vector-based visual aid designed to map the four critical categories of environmental damage onto a single, cohesive dashboard.
Target Audience: Ideal for Secondary School Science Teachers, University Environmental Studies, and Corporate CSR Sustainability reporting.
Visual Structure and Curriculum Alignment
Instead of using four separate slides, this infographic organizes data into four distinct sectors surrounding a central earth illustration. This supports the concept of "Global Impact" taught in most science curricula.
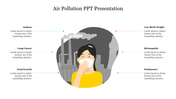
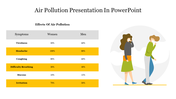
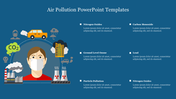
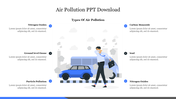
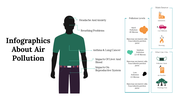
- Sector 1: Air Quality (Atmospheric Health)
- Best for: Presenting data on Particulate Matter, smog levels, factory emissions, and the Greenhouse Effect.
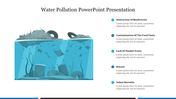
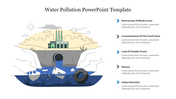
- Sector 2: Water Systems (Hydrology)
- Best for: Visualizing marine ecosystem data, including industrial runoff, oil spills, and the chemical composition of aquatic pollutants.
- Sector 3: Plastic Pollution (Marine & Urban)
- Best for: Mapping the lifecycle of microplastics, plastic waste accumulation in oceans, and the impact of non-biodegradable materials on wildlife.
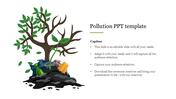
- Sector 4: Land & Soil (Lithosphere)
- Best for: Discussing waste management, landfill statistics, deforestation rates, and agricultural soil contamination.
Technical Specs
- File Format: .PPTX (Native PowerPoint)
- Compatibility: Microsoft PowerPoint, Google Slides, Canva
- Aspect Ratio: 16:9 (Widescreen)
- Editability: 100% Vector (Recolor, Resize, Edit Text)
Why Professionals Download This Template
- Agnostic Design: The vector graphics are style-neutral, making them suitable for both a Grade 5 science class and a Corporate CSR presentation.
- Zero Quality Loss: The graphics are vector-based. You can scale the central Earth icon to fit a large lecture hall screen without any pixelation or blur.
- Smart Theme Adaptation (Color Theme Support): This slide supports PowerPoint's "Color Theme" functionality. If you paste it into an existing presentation, the infographic will automatically adapt to your brand colors.
Download this Pollution Infographic template today to streamline your next Environmental Science lecture or sustainability report.
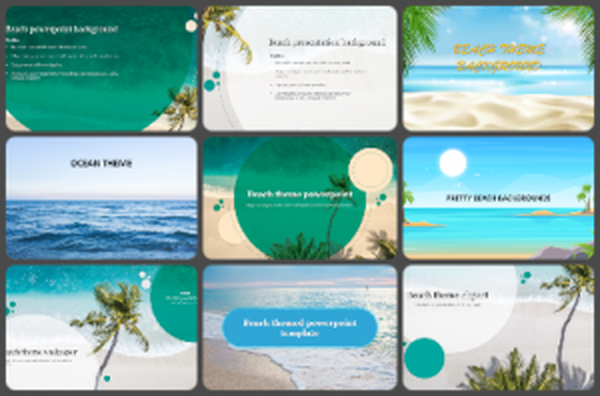
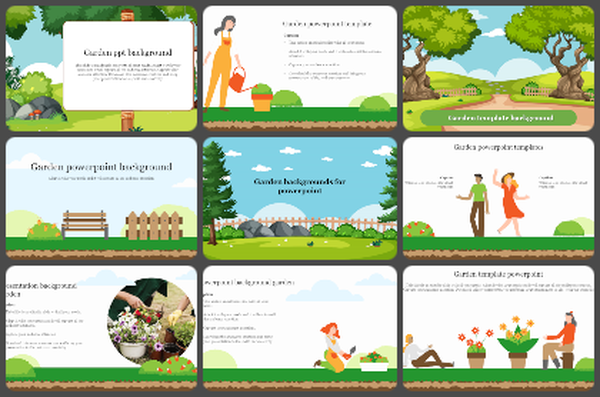
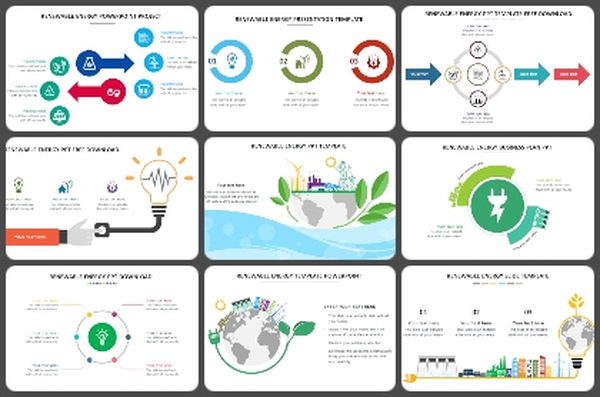
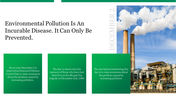
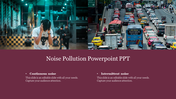
You May Also Like These PowerPoint Templates
Add to Wishlist
Download
Edit


Add to Wishlist
Download
Edit


Add to Wishlist
Download
Edit

Add to Wishlist
Download
Edit

Add to Wishlist
Download
Edit

Add to Wishlist
Download
Edit

Add to Wishlist
Download
Edit

Add to Wishlist
Download
Edit

Add to Wishlist
Download
Edit

Add to Wishlist
Download
Edit

Add to Wishlist
Download
Edit


Add to Wishlist
Download
Edit


Add to Wishlist
Download
Edit

Add to Wishlist
Download
Edit

Add to Wishlist
Download
Edit
