Merit Vs Demerit Goods Presentation And Google Slides

Merit Vs Demerit Goods PowerPoint, Google Slides, and Canva Template
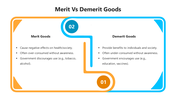
Merit vs Demerit Goods is a core concept in economics that helps explain how certain products affect society and individual well-being. Merit goods (like education or healthcare) are under-consumed if left to the free market, while demerit goods (like tobacco or junk food) tend to be over-consumed despite negative side effects. These goods influence public policy, taxation, and resource allocation in both developed and developing economies.
Purpose Of The Slides
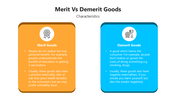
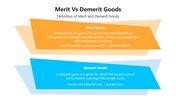
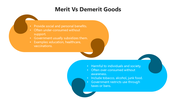
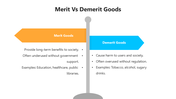
This slide simplifies the contrast between merit and demerit goods using a side-by-side visual structure. It presents definitions, examples, externalities, and market failures associated with each. Designed with students and educators in mind, the content allows for quick explanation of why governments may subsidize or tax certain goods based on societal impact.
Who Can Use It?
Ideal for economics teachers, business students, policy researchers, education consultants, and academic trainers. It’s suitable for classroom lectures, exam prep sessions, academic discussions, and public policy presentations.
Special Key Features
Part of a 13-slide themed deck, this Merit vs Demerit Goods PPT slide includes editable content areas, clear visuals, and intuitive layout—making it easy to adapt for any learning or presentation environment.
Download the Merit vs Demerit Goods slide today and explain economic behavior through engaging visuals and smart comparisons!
Features of this template
- 100% customizable slides and easy to download.
- The slides contain 16:9 and 4:3 formats.
- Easy to change the colors quickly.
- Highly compatible with PowerPoint, Google Slides, and Canva templates.
Explore Related Collections
Recommended based on this template.










You May Also Like These PowerPoint Templates
Showing36 of69,218 templates