Precise Map Presentation PowerPoint Template for Insights

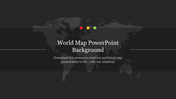

Editable Map Presentation Template
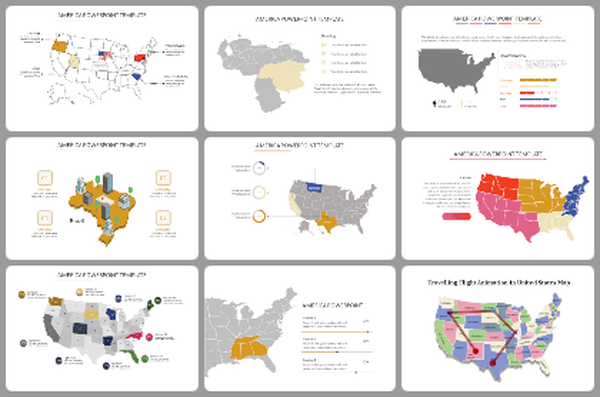
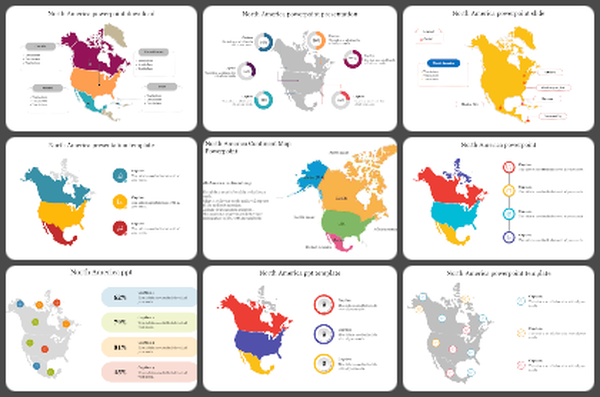
Are you tired of boring charts and graphs? Try this exciting Map PowerPoint Presentation Template with North Carolina! It features five orange nodes placed above the state. Each dot shows a percentage, making it easy to present local data or highlight important areas. Below the map, there are spaces to add more details and context about your data. The white background makes your information pop.
This template is perfect for anyone. Whether you’re a business professional showing market research, a student presenting regional demographics, or a teacher highlighting geographic trends, this map will make your data come to life. Just add your data, change the colors and fonts to match your style, and create an engaging presentation.
Ready to make your data more interesting? Download this template today and see the power of map-based presentations!
Features of the template
- Slides are available in different nodes & colors.
- Easy to change the slide colors.
- Well-crafted template with instant download.
- Highly compatible with PowerPoint and Google Slides.
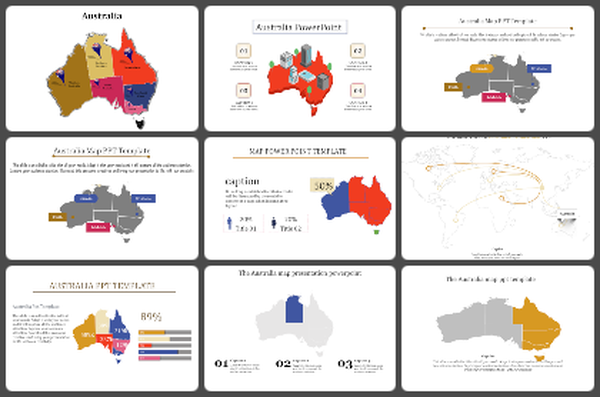
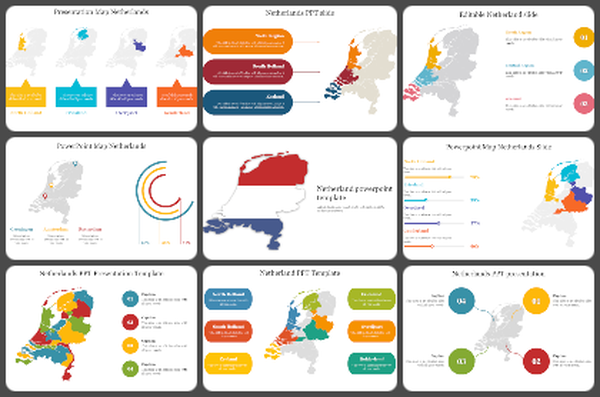
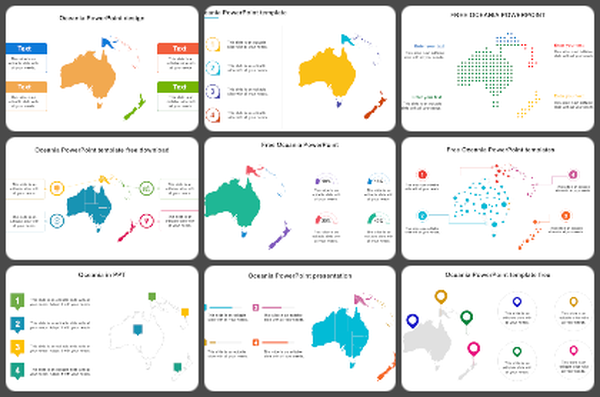
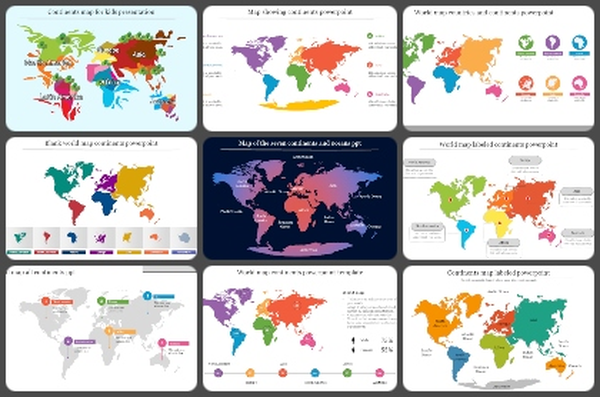
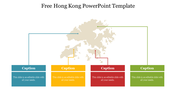
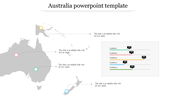
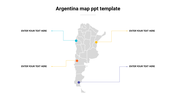
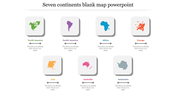
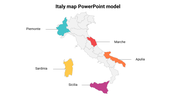
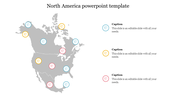
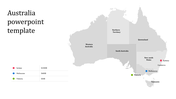
You May Also Like These PowerPoint Templates
Add to Wishlist
Download
AI Customize

Add to Wishlist
Download
AI Customize

Add to Wishlist
Download
AI Customize

Add to Wishlist
Download
AI Customize

Add to Wishlist
Download
AI Customize

Add to Wishlist
Download
AI Customize

Add to Wishlist
Download
AI Customize

Add to Wishlist
Download
AI Customize

Add to Wishlist
Download
AI Customize

Add to Wishlist
Download
AI Customize

Add to Wishlist
Download
AI Customize

Add to Wishlist
Download
AI Customize

Add to Wishlist
Download
AI Customize


Add to Wishlist
Download
AI Customize

Add to Wishlist
Download
AI Customize

Add to Wishlist
Download
AI Customize

Add to Wishlist
Download
AI Customize

Add to Wishlist
Download
AI Customize

Add to Wishlist
Download
AI Customize
