Compare Gains And Losses PowerPoint And Google Slides

 Canva
Canva
Gains And Losses PPT, Google Slides, and Canva Template
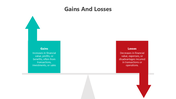
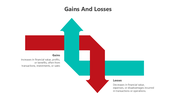
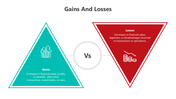
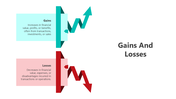
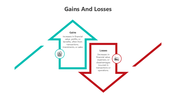
Gains and Losses refer to the financial outcomes resulting from business operations, investments, or personal finances. Gains represent the positive returns from activities like sales, investments, or asset appreciation, while losses indicate negative results such as operational setbacks, declining asset values, or failed ventures. Understanding gains and losses is essential for evaluating financial health, improving decision-making, and creating strategies to optimize outcomes.
Purpose Of The Slides
The Gains and Losses PowerPoint Template is a versatile 11-slide deck crafted to illustrate key financial concepts, trends, and strategies. Featuring a vibrant multicolor theme, this template allows presenters to break down complex ideas like profit margins, risk analysis, and financial forecasting. Each slide is fully customizable, making it an ideal choice for professionals looking to create visually appealing and informative presentations.
Who Can Use It?
- Finance Professionals: Showcase gains and losses in reports, forecasts, and performance reviews.
- Educators and Students: Explain financial concepts and their impact in academic projects or lectures.
- Business Leaders: Discuss financial outcomes and strategies for optimizing profits.
- Investors and Analysts: Present insights on investment performance and risk management.
Special Key Features
Simplify financial analysis with impactful visuals! Download the Gains and losses PowerPoint template today to create professional and engaging presentations that captivate your audience. Turn complex financial data into clear, actionable insights with this expertly designed slide deck!
Features of this template
- 100% customizable slides and easy to download.
- The slides contain 16:9 and 4:3 formats.
- Easy to change the colors quickly.
- Highly compatible with PowerPoint, Google Slides, and Canva Presentation.


You May Also Like These PowerPoint Templates
Add to Wishlist
Download
Edit

Add to Wishlist
Download
Edit


Add to Wishlist
Download
Edit


Add to Wishlist
Download
Edit

Add to Wishlist
Download
Edit

Add to Wishlist
Download
Edit

Add to Wishlist
Download
Edit


Add to Wishlist
Download
Edit

Add to Wishlist
Download
Edit

Add to Wishlist
Download
Edit

Add to Wishlist
Download
Edit

Add to Wishlist
Download
Edit

Add to Wishlist
Download
Edit

Add to Wishlist
Download
Edit

Add to Wishlist
Download
Edit

Add to Wishlist
Download
Edit

Add to Wishlist
Download
Edit
