Free - Clinical Case In Neurology Infographics PPT And Google Slides
Free

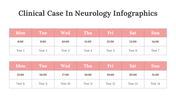

Clinical Case In Neurology Infographics Presentation Templates
Neurological cases often require a high volume of data to reach a valid conclusion. This infographic collection provides a modular framework to organize complex brain and nervous system studies. It is a precise resource for neurologists, medical researchers, and clinical educators who need to move beyond static text to dynamic, data-driven visuals.
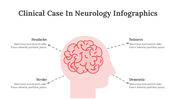
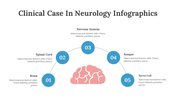
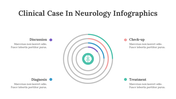
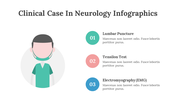
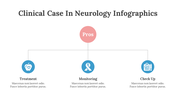
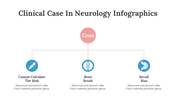
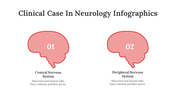
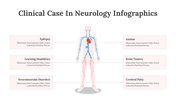
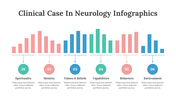
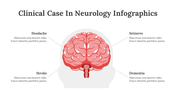
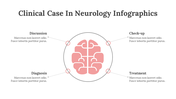
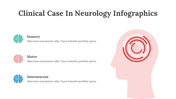
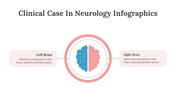
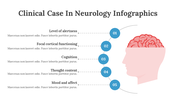
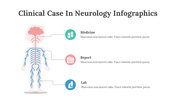
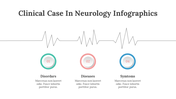
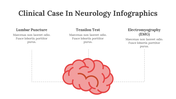
The slides are built for a layered diagnostic approach. You can start with broad physiological overviews, such as the distinction between left and right brain functions or the pathways of the peripheral nervous system. For clinical depth, the deck includes specific layouts for diagnostic testing, covering Lumbar Punctures, Tensilon Tests, and EMG results. It also tracks patient metrics like alertness levels, cognition, and mood changes through clean, numbered lists and circular progress maps.
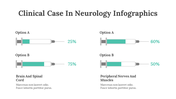
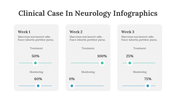
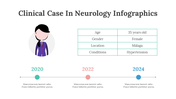
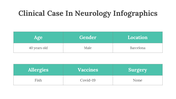
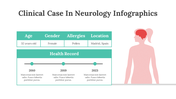
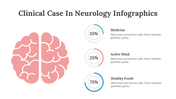
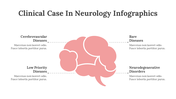
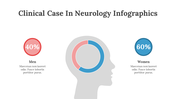
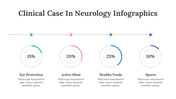
A unique feature of this toolkit is its quantitative versatility. It provides syringe-style charts, weekly test schedules, and gender-based demographic rings. You can visualize the impact of lifestyle factors—like "Active Mind" and "Healthy Foods"—alongside technical medical reports and lab data. Whether you are analyzing rare neurodegenerative disorders or tracking common cerebrovascular diseases, this collection provides the exact icons and timelines needed for a professional briefing.
Select this infographic set to turn raw neurological data into a clear, professional medical narrative.
Features of this template:
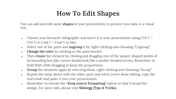
- Fully editable slides.
- Works in PowerPoint, Google Slides, and Canva.
- Available in 16:9 and 4:3 formats.
- Anatomical Blueprints: Technical icons for left/right brain, spinal cord, and nerve cells.
- Test Monitoring Grids: A 14-slot weekly schedule for clinical testing and lab results.
- Behavioral Health Charts: Specific metrics for mood, affect, thought content, and cognition.
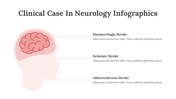
- Condition-Specific Layouts: Built-in segments for Stroke, Epilepsy, Autism, and Brain Tumors.
- Data Visualization: Syringe-style percentage bars and circular progress rings for treatment tracking.


You May Also Like These PowerPoint Templates
Add to Wishlist
Download
AI Customize

Add to Wishlist
Download
AI Customize

Add to Wishlist
Download
AI Customize

Add to Wishlist
Download
AI Customize


Add to Wishlist
Download
AI Customize

Add to Wishlist
Download
AI Customize

Add to Wishlist
Download
AI Customize


Add to Wishlist
Download
AI Customize

Add to Wishlist
Download
AI Customize

Add to Wishlist
Download
AI Customize

Add to Wishlist
Download
AI Customize


Add to Wishlist
Download
AI Customize

Add to Wishlist
Download
AI Customize

Add to Wishlist
Download
AI Customize

Add to Wishlist
Download
AI Customize

Add to Wishlist
Download
AI Customize


Free
Add to Wishlist
Download
AI Customize

Free
Add to Wishlist
Download
AI Customize


Add to Wishlist
Download
AI Customize


Add to Wishlist
Download
AI Customize

Add to Wishlist
Download
AI Customize


Add to Wishlist
Download
AI Customize


Add to Wishlist
Download
AI Customize

Free
Add to Wishlist
Download
AI Customize
