Free - Affordable Circle Infographic PowerPoint In Red Color Slide
Free

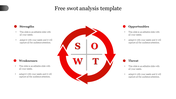

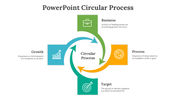
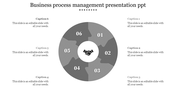
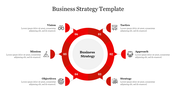
Engaging Circle Infographic Slide With Red Theme
Our circle infographic PowerPoint template is a modern, creative, and fully customizable template. This template is perfect for presenting your data and visualizing complex information in an easy-to-understand way. Also, the template is made up of themed circles, each circle has an icon to match your specific needs. In addition, the template also includes captions and arrows to make your presentation more engaging and visually appealing. However, all the elements are editable, so it's up to you to add your unique ideas.
Features of the Template
- 100 % customizable slides and easy-to-download
- Slides are available in different nodes & colors.
- It comes with a red theme.
- The slide contains 6:9 and 4:3 formats.
- Easy to change the slide colors quickly.
- It is a well-crafted template with an instant download facility.
- We designed this slide with a stunning design.
- It comes with four nodes.


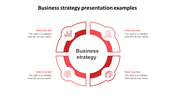
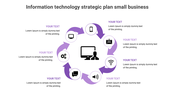
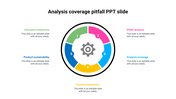
You May Also Like These PowerPoint Templates
Add to Wishlist
Download
Edit

Add to Wishlist
Download
Edit

Add to Wishlist
Download
Edit

Add to Wishlist
Download
Edit

Add to Wishlist
Download
Edit


Add to Wishlist
Download
Edit

Add to Wishlist
Download
Edit

Add to Wishlist
Download
Edit


Add to Wishlist
Download
Edit

Add to Wishlist
Download
Edit


Add to Wishlist
Download
Edit

Add to Wishlist
Download
Edit


Add to Wishlist
Download
Edit
