Free - Get the Best Cause and Effect Diagram Template PowerPoint
Free

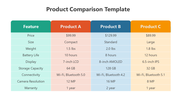

Cause and Effect Diagram Presentation Slide
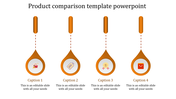
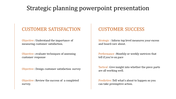
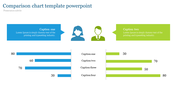
Unlock the power of visual storytelling with our captivating Cause and Effect Diagram Template PowerPoint. Whether you're exploring Fishbone, Ishikawa, Herringbone, Cause and Effect Analysis, Root Cause Analysis, or the renowned 5 Whys technique, our professionally designed, customizable templates are your gateway to insightful presentations. Dive into a sea of multicolored 3D pyramids that visually represent your concepts and ideas. Just insert your content and let the image do the talking. Engage your audience, encourage critical thinking, and bring your presentations to life with our templates. Ask your audience to take the plunge and harness the potential of these templates to make your data come alive. Make your content stand out effortlessly, guiding your audience through the cause-and-effect journey they won't forget.
Features of the template
- 100% customizable slides and easy to download.
- Slides are available in different colors
- The slide has 4:3 and 16:9 formats.
- Easy to change the slide colors quickly.
- Appealing Presentation to impress an audience.
- Create feature-rich slide presentations.
- An eye-pleasing color slide helps to give a catchy display.
- Highly compatible with PowerPoint and Google Slides.


You May Also Like These PowerPoint Templates
Add to Wishlist
Download
AI Customize

Add to Wishlist
Download
AI Customize

Add to Wishlist
Download
AI Customize

Add to Wishlist
Download
AI Customize

Add to Wishlist
Download
AI Customize

Add to Wishlist
Download
AI Customize


Add to Wishlist
Download
AI Customize

Add to Wishlist
Download
AI Customize

Add to Wishlist
Download
AI Customize

Add to Wishlist
Download
AI Customize

Add to Wishlist
Download
AI Customize

Add to Wishlist
Download
AI Customize

Add to Wishlist
Download
AI Customize

Add to Wishlist
Download
AI Customize

Add to Wishlist
Download
AI Customize

Add to Wishlist
Download
AI Customize

Add to Wishlist
Download
AI Customize

Add to Wishlist
Download
AI Customize

Add to Wishlist
Download
AI Customize
