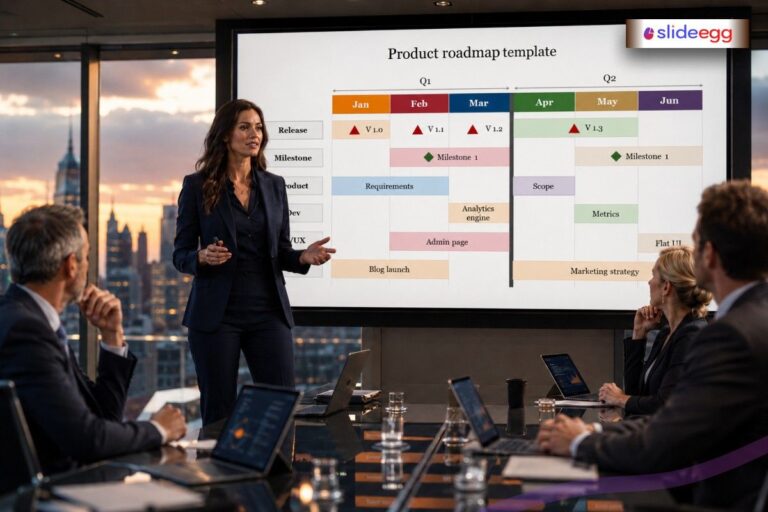
Business communication is faster in 2026, and people do not have time for long reports or text-heavy slides. That is why businesses use process infographic presentations. They turn complex workflows into clear visual steps using icons, timelines, and flow diagrams.
A process infographic works like a roadmap. It helps teams understand where the process starts, how each step connects, and what comes next without confusion.
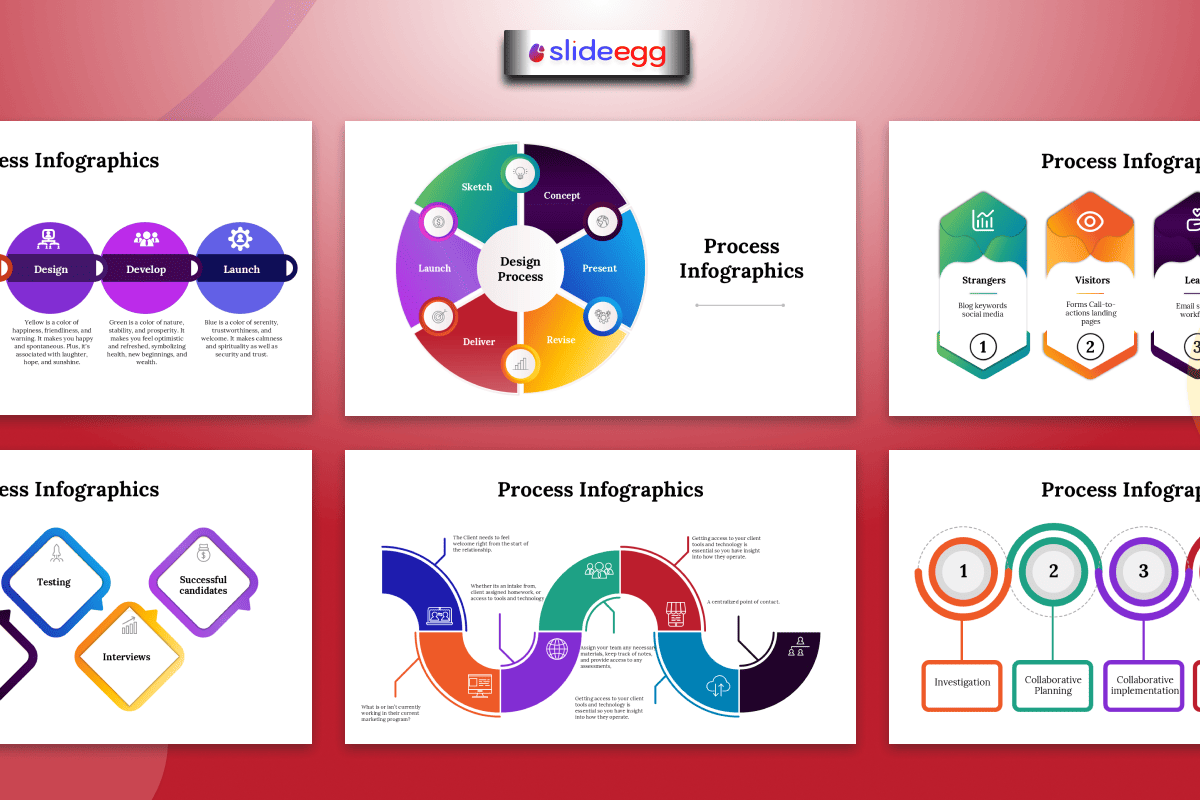
What Is a Process Infographic Presentation?
A process infographic presentation explains a workflow from start to finish using visuals like arrows, timelines, icons, flowcharts, and step-by-step layouts.
Businesses use it for project workflows, customer journeys, onboarding, sales funnels, operations, product development, and marketing campaigns.
The goal is simple: make complex information clear, quick, and easy to follow.
Why Businesses Need Visual Communication More Than Ever
In 2026, companies deal with constant information overload.
Employees receive:
- emails
- reports
- dashboards
- analytics
- meeting updates
- project notes
When too much information arrives at once, people lose focus quickly.
This creates:
- communication gaps
- misunderstandings
- slower decision-making
- reduced productivity
Process infographic presentations help reduce this problem because visuals organize information naturally.
The human brain processes images much faster than text. That means employees can understand workflows in seconds instead of spending time reading complicated explanations.
A good infographic presentation template acts like a shortcut for understanding.
How Different Business Teams Use Process Infographics
Business Owners
Business owners often need to explain ideas quickly to employees, clients, or investors.
Instead of using lengthy documents, they use process infographic slides to present:
- business strategies
- operational systems
- growth plans
- company workflows
Visual presentations help audiences see the “big picture” more clearly.
Project Managers
Project managers handle timelines, tasks, approvals, and team coordination every day.
A process infographic presentation helps organize project stages visually so teams understand:
- What happens first
- What comes next
- Who is responsible
- where deadlines exist
When workflows are visible, projects usually run more smoothly.
Marketing Teams
Marketing campaigns involve many moving parts.
Teams manage:
- content planning
- social media
- advertising
- email campaigns
- analytics tracking
Process infographics help marketing teams explain campaign flow step by step without overwhelming audiences with too much detail.
This improves collaboration and keeps teams aligned.
Operations Managers
Operations teams focus heavily on efficiency and organization.
Process infographic templates help explain:
- inventory systems
- logistics workflows
- production stages
- customer service operations
Visual workflows also make it easier to identify bottlenecks and improve productivity.
Startup Founders
Startups often need to explain business models and customer journeys quickly during investor meetings.
A process infographic presentation helps founders simplify:
- revenue flow
- product development
- user onboarding
- customer acquisition
Strong visuals make startup ideas feel easier to understand and more professional.
Why Process Infographics Improve Meetings
Many business meetings become confusing because information feels scattered.
People lose attention when presentations contain:
- too much text
- disconnected ideas
- unclear workflows
- crowded slides
Process infographic presentations solve this problem by creating structure.
Visual workflows guide audiences naturally from one point to another.
This helps meetings feel:
- more organized
- more engaging
- easier to follow
- more productive
A clear process slide works almost like a conversation map. It helps everyone stay on the same page.
The Rise of Interactive Presentations in 2026
Modern businesses are moving beyond static slides.
Many companies now combine process infographic presentations with an interactive presentation tool to improve engagement during:
- remote meetings
- training sessions
- webinars
- sales presentations
Interactive features may include:
- animated workflow steps
- clickable diagrams
- live dashboards
- collaborative editing
- audience participation tools
These features make presentations feel more dynamic and less like one-way communication.
In remote work environments, especially, interaction helps people stay focused longer.
Final Thoughts
Businesses use process infographic presentations in 2026 because teams need faster, clearer communication.
Instead of long text-heavy slides, process infographics help businesses explain workflows, systems, milestones, and strategies visually. They make meetings easier, improve teamwork, and help people understand complex ideas quickly.
For business owners, project managers, marketers, operations managers, and startup founders, process infographics are no longer just design elements. They are practical tools for clear business communication.
FAQs
What is a process infographic presentation?
A process infographic presentation visually explains workflows, systems, or step-by-step tasks using charts, arrows, diagrams, and timelines.
Why do businesses use process infographic slides?
Businesses use them to simplify communication, explain workflows clearly, and improve audience understanding during meetings and presentations.
Are process infographic templates useful for project management?
Yes. Project managers use them to organize timelines, task flows, milestones, and project stages visually.
Can free PowerPoint templates work for business presentations?
Yes. A free PowerPoint template can work for simple business presentations, especially for startups and internal meetings.
How do interactive presentations improve presentations?
Interactive presentation tools increase engagement through animations, clickable sections, live updates, and collaborative presentation features.