Get Unlimited Infographic PPT Presentation Slide Themes

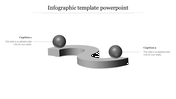
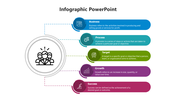
Infographic PowerPoint Template
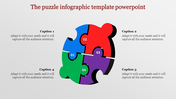
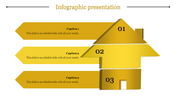
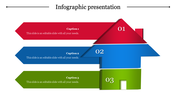
Improve your presentations with the dynamic Infographic PowerPoint Template and Google Slides Themes. Crafted with precision, this template boasts four nodes, each equipped with a captivating caption, a title holder, and a spacious text area.
Whether you're a savvy entrepreneur, a dedicated educator, or a forward-thinking professional, this versatile template caters to your diverse needs. Seamlessly blend creativity with professionalism as you engage your audience with visually stunning slides that convey your message with clarity and impact.
Search for innovation and streamline your workflow with a design that sets you apart from the mundane. Transform your presentations into memorable experiences that leave a lasting impression. Embrace the future of presentations with the infographic template – where style meets substance, and excellence is the standard.
Features of the Template
- 100 % customizable slides.
- The slide show is in 4:3, 16:9, zip format.
- There is powerful connectivity with Google Slides and PowerPoint.
- It is simple and quick to alter the slide's color.
- An efficient template that can be easily accessed immediately.
- Well-crafted template with an instant download facility.


You May Also Like These PowerPoint Templates
Add to Wishlist
Download
Edit

Add to Wishlist
Download
Edit


Add to Wishlist
Download
Edit

Add to Wishlist
Download
Edit

Add to Wishlist
Download
Edit


Add to Wishlist
Download
Edit


Add to Wishlist
Download
Edit

Add to Wishlist
Download
Edit

Add to Wishlist
Download
Edit

Add to Wishlist
Download
Edit

Add to Wishlist
Download
Edit

Add to Wishlist
Download
Edit


Add to Wishlist
Download
Edit

Add to Wishlist
Download
Edit
