MILESTONE 🌟 5 Million+ creative minds trust SlideEgg! Grab 80% OFF

Easy To Edit Growth PPT and Google Slides Presentation

Growth chart with green cylindrical tiers labeled 15%, 30%, 45%, and 60%, connected to caption areas.
P.ID : 10782
    156 views
    4 Downloads
    Get Custom Slides by Experts
    Instantly Access Templates in PowerPoint

    Growth PowerPoint Template


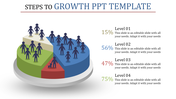
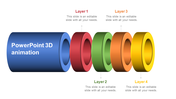
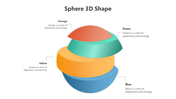
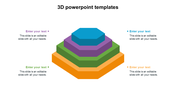
    Begin your journey of exponential growth with our Growth PowerPoint template. It is designed to ignite your presentations. The slide comes with a clean backdrop. A vibrant cylindrical growth phase diagram takes the center to radiate with attractive colors and precision. Each section of the cylinder is labeled with percentage values to symbolize phases of growth.

    Captions and descriptions find a home beside this dynamic image. This offers you the canvas to narrate your growth story with clarity. Perfect for entrepreneurs, marketers and business leaders. An ideal template to provide narratives for stakeholders and investors. Download the template to propel your growth story to new heights.

    Features of the template

    • The slide contains 16:9 and 4:3 formats.
    • Compatible with Google Slides Themes and PowerPoint.
    • 100% customizable slides and easy to download.
    • It is easy to change the colors of the slide quickly.
    • Well-crafted template with an instant download facility.
    Advertisement

    You May Also Like These PowerPoint Templates

    Add to Wishlist
    Download
    AI Customize
    Slide explaining the volume of cubes, featuring a formula and example calculation with a cube illustration.
    Add to Wishlist
    Download
    AI Customize
    Bold four blocker design with 3D effect, featuring engaging colors and icons and with four caption areas.
    Add to Wishlist
    Download
    AI Customize
    Innovative PowerPoint Funnel Template Download Slide
    Add to Wishlist
    Download
    AI Customize
    Slide deck showcasing various pie chart infographics in different colors and sections for data visualization.
    Add to Wishlist
    Download
    AI Customize
    Color-coded break-even analysis with bars from 10M to 30M along a rising dotted line and text areas for values.
    Add to Wishlist
    Download
    AI Customize
    Vertical arrangement of 3D cubes in blue, orange, green, and purple, each with a caption explaining the color meaning.
    Add to Wishlist
    Download
    AI Customize
    Data Cube PPT Presentation Template and Google Slides
    Free
    Add to Wishlist
    Download
    AI Customize
    A slide featuring three blue arrows labeled with keywords pointing towards a green 3D cylinder, representing animation flow.
    Free
    Add to Wishlist
    Download
    AI Customize
    Five floating 3D squares in red, blue, orange, purple, and cyan, each with numbers and icon on a light background.
    Add to Wishlist
    Download
    AI Customize
    A PowerPoint slide showcasing 3D animation with options to Buy, Sale, and Invest, highlighted by a diamond image.
    Add to Wishlist
    Download
    AI Customize
    Diagram illustrating the innovation funnel stages target audience, suspect, lead, opportunity, deal with placeholder text.
    Add to Wishlist
    Download
    AI Customize
    Infographic slide showcasing a cubes strategy presentation with seven colorful cubes and corresponding text captions.
    Add to Wishlist
    Download
    AI Customize
    Colorful stakeholder map slide illustrating core, direct, and indirect stakeholders with space for text descriptions.