Free - Free Editable Map of Australia PPT Template & Google Slides

Free
Australia map split into colored sections, highlighting states with green, grey, maroon, red, and yellow areas with captions.
P.ID : 59956
    2.3K+ views
    479 Downloads
    Get Custom Slides by Experts
    Instantly Access Templates in PowerPoint

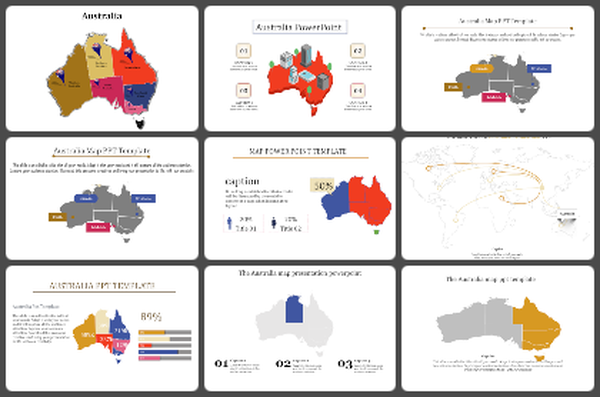
    Australia Map Presentation Slide

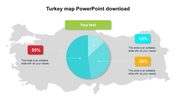
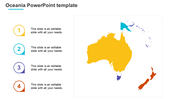
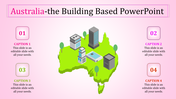
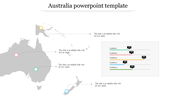
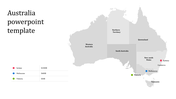
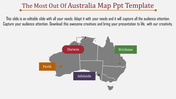
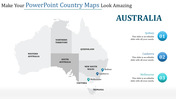
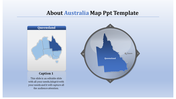
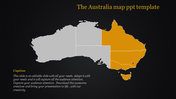
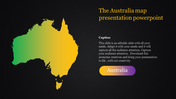
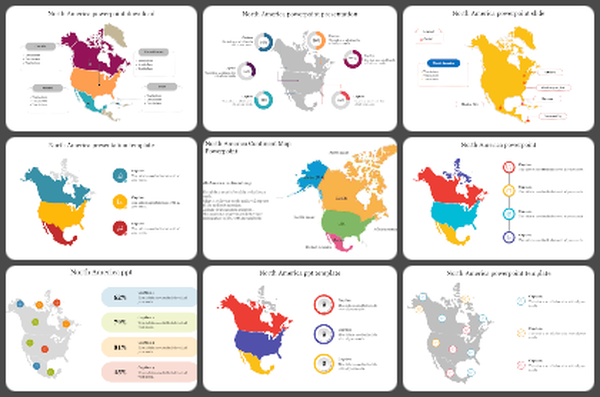
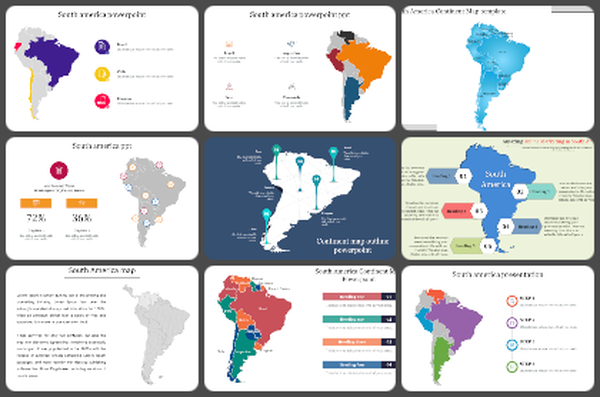
    Australia is a continent and a country located in the southern hemisphere of the world. It is the world's sixth-largest country by total area and has a diverse range of landscapes, including mountains, deserts, tropical forests, and beaches. The map of Australia depicts the country's seven states and territories, which are Western Australia, Northern Territory, Queensland, New South Wales, Victoria, Tasmania, and South Australia. It also shows the country's capital city, Canberra, located in the Australian Capital Territory. This Guideline Editable Map Of Australia PPT Template helps you to create a presentation at no time. This template has the political outline map of Australia. Use this elegant template and elevate your geographical-themed data representations in an impressive way.


    Features of the template

    • 100% customizable slides and easy to download.
    • Slides are available in different nodes & colors.
    • The slide contains 16:9 and 4:3 formats.
    • Easy to change the colors of the slide quickly.
    • Well-crafted template with an instant download facility.
    • It has specific space for text.
    • Highly compatible with PowerPoint and Google Slides.
    • Create a feature-rich slide presentation.
    Advertisement

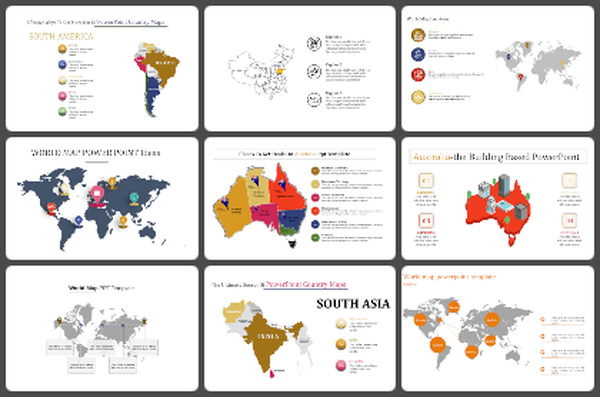
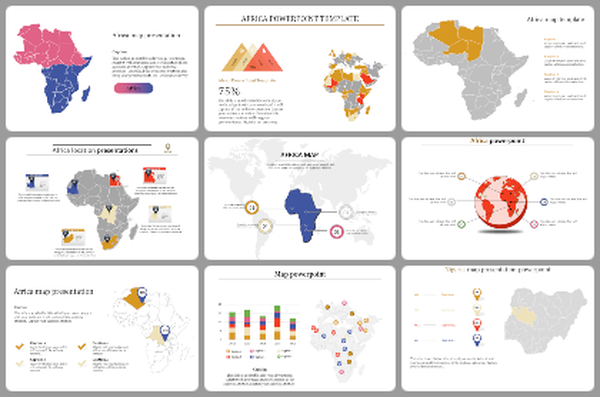
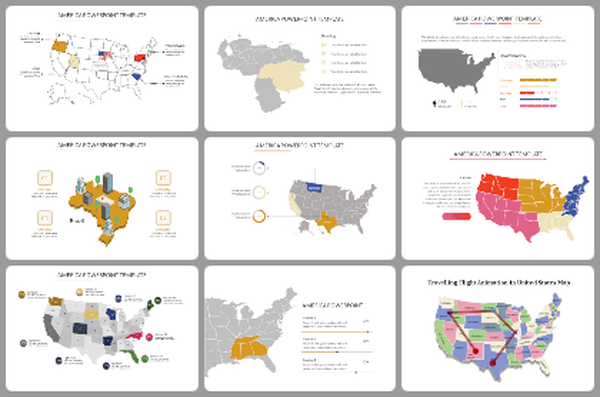
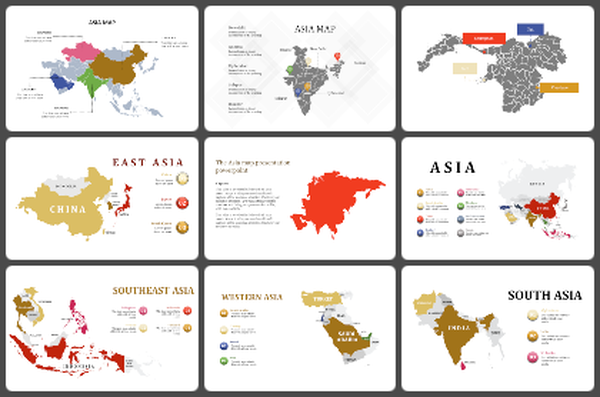
    You May Also Like These PowerPoint Templates

    Add to Wishlist
    Download
    AI Customize
    Australia map template showing three labeled points, linked to percentage metrics and text placeholders.
    Add to Wishlist
    Download
    AI Customize
    A colorful map of Australia with each region in different colors, featuring Australian flags and markers.
    Add to Wishlist
    Download
    AI Customize
    Blue toned Australia map with five labeled regions connected by markers and lines, featuring captions around it.
    Add to Wishlist
    Download
    AI Customize
    Australia map with colored sections showing population data, alongside a bar chart indicating percentages.
    Add to Wishlist
    Download
    AI Customize
    Colorful map of Australia highlighting different regions with location markers and placeholder text box.
    Add to Wishlist
    Download
    AI Customize
    Map of Australia with six highlighted regions in different colors, each labeled and numbered on the right.
    Add to Wishlist
    Download
    AI Customize
    Australian map is divided into vibrant sections representing different states and territories, each labeled with numbers.
    Add to Wishlist
    Download
    AI Customize
    Editable Map Of Australia PowerPoint Presentation
    Add to Wishlist
    Download
    AI Customize
    Blue map of Australia with the UK flag overlaid, and text detailing on the right, set against a white backdrop.
    Add to Wishlist
    Download
    AI Customize
    Color-coded map slide of Australia with major states and territories, including Western Australia, Queensland, and Tasmania.
    Free
    Add to Wishlist
    Download
    AI Customize
    Australia map split into colored sections, highlighting states with green, grey, maroon, red, and yellow areas with captions.
    Add to Wishlist
    Download
    AI Customize
    Slide featuring a map of Australia with data points highlighted, displaying percentages at various locations text area.
    Add to Wishlist
    Download
    AI Customize
    Australia map with five colored states and markers with population data and corresponding numbered captions on the left.
    Add to Wishlist
    Download
    AI Customize
    Color coded Australia map with labeled states and flag markers in pink, yellow, orange, teal, and blue regions with text.
    Add to Wishlist
    Download
    AI Customize
    Australia map marked with red and black location pins representing transport modes, paired with horizontal bar charts.