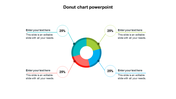
Incredible Doughnut Chart Powerpoint And Google Slides

Circular doughnut with rings in green, yellow, red, and blue, each marked with percentage and matching text box on the right.
P.ID : 2030
    1.5K+ views
    352 Downloads
    Get Custom Slides by Experts
    Instantly Access Templates in PowerPoint

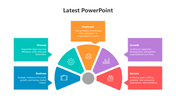
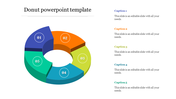
    Creative Doughnut Chart PowerPoint Template


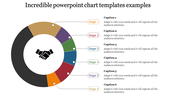
    Our doughnut chart PowerPoint template is designed to help you visually represent data in an engaging and easy-to-understand format. This template is perfect for presenting proportions, percentages, and relationships within your data, making it an ideal tool for business analysts, marketers, educators, and data scientists. The doughnut chart format offers a clear and concise way to compare different categories, helping your audience quickly grasp key insights and trends.

    With customizable slides, you can tailor the charts to match your brand's identity and highlight the most important data points. This template not only enhances the visual appeal of your presentations but also saves you time in creating professional and impactful charts. By using this template, you can ensure that your data presentations are both informative and visually compelling. Make your data stand out with our doughnut chart PowerPoint template. Download this template today!

    Features of this template


    • 100% customizable slides and easy to download.
    • The slide contains 16:9 and 4:3 formats.
    • Easy to change the colors of the slide quickly.
    • Highly compatible with PowerPoint and Google Slides.
    Advertisement

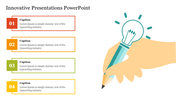
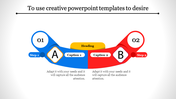
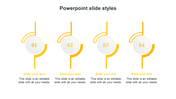
    You May Also Like These PowerPoint Templates

    Add to Wishlist
    Download
    AI Customize
    Circular doughnut chart with four layers in blue, red, pink, and yellow, pointing to captions and a central group icon.
    Add to Wishlist
    Download
    AI Customize
    Target achievement breakdown with three orange-accented donut charts indicating 60%, 40%, and 20%.
    Free
    Add to Wishlist
    Download
    AI Customize
    Dynamic spiral chart with four red concentric layers, each labeled with percentages and captions.
    Free
    Add to Wishlist
    Download
    AI Customize
    Doughnut chart with teal, green, and blue segments showing percentages  and medical icons, with matching text box.
    Add to Wishlist
    Download
    AI Customize
    Slide deck with multiple 3D and flat donut charts in vibrant colors, illustrating different data distributions.
    Free
    Add to Wishlist
    Download
    AI Customize
    Doughnut chart slide with layered rings in various colors, labeled with icons and text area on a white background.
    Add to Wishlist
    Download
    AI Customize
    Circular road themed donut slide with eight labeled options around a looped road graphic, featuring a car and a location pin.
    Add to Wishlist
    Download
    AI Customize
    A donut chart in multicolour with arrows and icons placed with three caption areas.
    Add to Wishlist
    Download
    AI Customize
    3D donut chart divided into five colorful segments labeled with percentages, and captions on the right.
    Add to Wishlist
    Download
    AI Customize
    Circular donut chart template with four sections in different colors, each with a description area.
    Add to Wishlist
    Download
    AI Customize
    Circular doughnut with rings in green, yellow, red, and blue, each marked with percentage and matching text box on the right.
    Add to Wishlist
    Download
    AI Customize
    Slide featuring a 3D donut chart with a highlighted green section and descriptive text on a gray background.
    Add to Wishlist
    Download
    AI Customize
    Slide showing two black circular tracks with yellow cars, white dashed lines, and labeled captions over a gray background.
    Add to Wishlist
    Download
    AI Customize
    Canvas slide with a doughnut chart displaying data in three segments, accompanied by descriptive text on the left.
    Free
    Add to Wishlist
    Download
    AI Customize
    Doughnut chart design with a blue 60% chart on the left and a red 50% chart on the right, each with bar graphs beneath them.
    Add to Wishlist
    Download
    AI Customize
    Donut shaped PowerPoint template with options placed around a circular path, featuring a yellow car moving along the road.
    Add to Wishlist
    Download
    AI Customize
    Donut chart PowerPoint template with four color coded sections labeled with percentages.
    Add to Wishlist
    Download
    AI Customize
    Infographic with four circular donut charts featuring progress levels, alternating in red and green with caption areas.