Best Circle Infographic PowerPoint Presentation

Four section circular infographic with overlapping colored circles labeled 01 to 04, each with a caption.
P.ID : 6834
    677 views
    26 Downloads
    Get Custom Slides by Experts
    Instantly Access Templates in PowerPoint

    Circle Infographic Presentation Slide

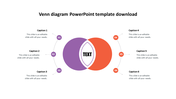
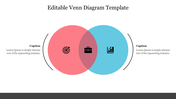
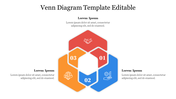
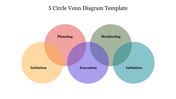
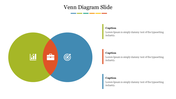
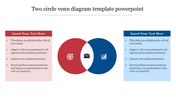
    Ikigai is the activity we carry for the purpose of happiness. Ikigai means Reason-of-Existence to make life worthwhile. It consists of four elements that are the source of value in a person’s life. You can use this concept to comprise any four elements of your data. With the vibrant Venn diagram, you can make its association clear. Make your data display calm and concise with this slide. Be the peacemaker of your arena and let it be presented in your PPTs too. Download now for more perks.

    Features of the template:

    • 100% customizable slides and easy to download.
    • Slides are available in different nodes & colors.
    • The slide contained 16:9 and 4:3 formats.
    • Easy to change the slide colors quickly.
    • Well-crafted template with instant download facility.
    • Fantastic four nodes added.
    • Ideal one for motivational PPTs.
    Advertisement

    You May Also Like These PowerPoint Templates

    Free
    Add to Wishlist
    Download
    AI Customize
    Three circle orange diagram highlighting the intersection of offerings and customer needs placed in a white backdrop.
    Free
    Add to Wishlist
    Download
    AI Customize
    Professional Venn diagram slide with interconnected blue circles highlighting key business and success factors with icons.
    Free
    Add to Wishlist
    Download
    AI Customize
    How To Insert A Venn Diagram In Microsoft PowerPoint Slide
    Add to Wishlist
    Download
    AI Customize
    Affordable Target Operation Model PPT Presentation
    Free
    Add to Wishlist
    Download
    AI Customize
    Venn diagram PPT template with overlapping yellow circles with icons and captions on a white backdrop.
    Free
    Add to Wishlist
    Download
    AI Customize
    Green Venn diagram PowerPoint template with overlapping circles representing business, strategy, growth, and finance.
    Add to Wishlist
    Download
    AI Customize
    Venn diagram Google Slides with five colorful circles, each representing a category with icons and placeholder text.
    Add to Wishlist
    Download
    AI Customize
    Venn diagram illustrating three overlapping shapes with labeled sections representing different ideas, alongside captions.
    Add to Wishlist
    Download
    AI Customize
    Venn diagram with yellow, red, purple, and blue sections, highlighting shared intersections with captioned text.
    Add to Wishlist
    Download
    AI Customize
    Business process Venn diagram template showing steps with colorful circular stages and icons with placeholder text.
    Free
    Add to Wishlist
    Download
    AI Customize
    Creative Venn Diagram PowerPoint Template Download
    Add to Wishlist
    Download
    AI Customize
    Colorful venn diagram with six overlapping sections in red, blue, yellow, orange, purple, and green, each with captions.
    Free
    Add to Wishlist
    Download
    AI Customize
    Our Predesigned Venn Diagram Google Slide Template
    Add to Wishlist
    Download
    AI Customize
    Free Venn Diagram Template PowerPoint Model Presentation
    Free
    Add to Wishlist
    Download
    AI Customize
    Company strategic plan example slide showing a green Venn diagram with Debt free, Location free, and Financially free areas.
    Free
    Add to Wishlist
    Download
    AI Customize
    Enrich your Free Venn Diagram Template PowerPoint Slide
    Add to Wishlist
    Download
    AI Customize
    Venn diagram PowerPoint template with three overlapping circles labeled 01, 02, and 03 with placeholder text.
    Free
    Add to Wishlist
    Download
    AI Customize
    Venn diagram PPT slide featuring three orange overlapping circles and business related icons with placeholder text.
    Add to Wishlist
    Download
    AI Customize
    Data analysis slide featuring a Venn diagram with two overlapping circles representing data metrics with captions.