Venn diagrams – those nifty circles that visually represent overlaps between concepts – are a presentation staple. They help audiences grasp relationships between ideas in a clear and concise way. Whether you’re comparing hobbies of different age groups or analyzing the strengths and weaknesses of two companies, a well-crafted Venn diagram can be a powerful tool.
But how do you create a Venn diagram in Google Slides? This guide will walk you through the process step-by-step, ensuring your next presentation boasts a beautifully informative Venn diagram.
Beyond Circles: The Power of Venn Diagrams
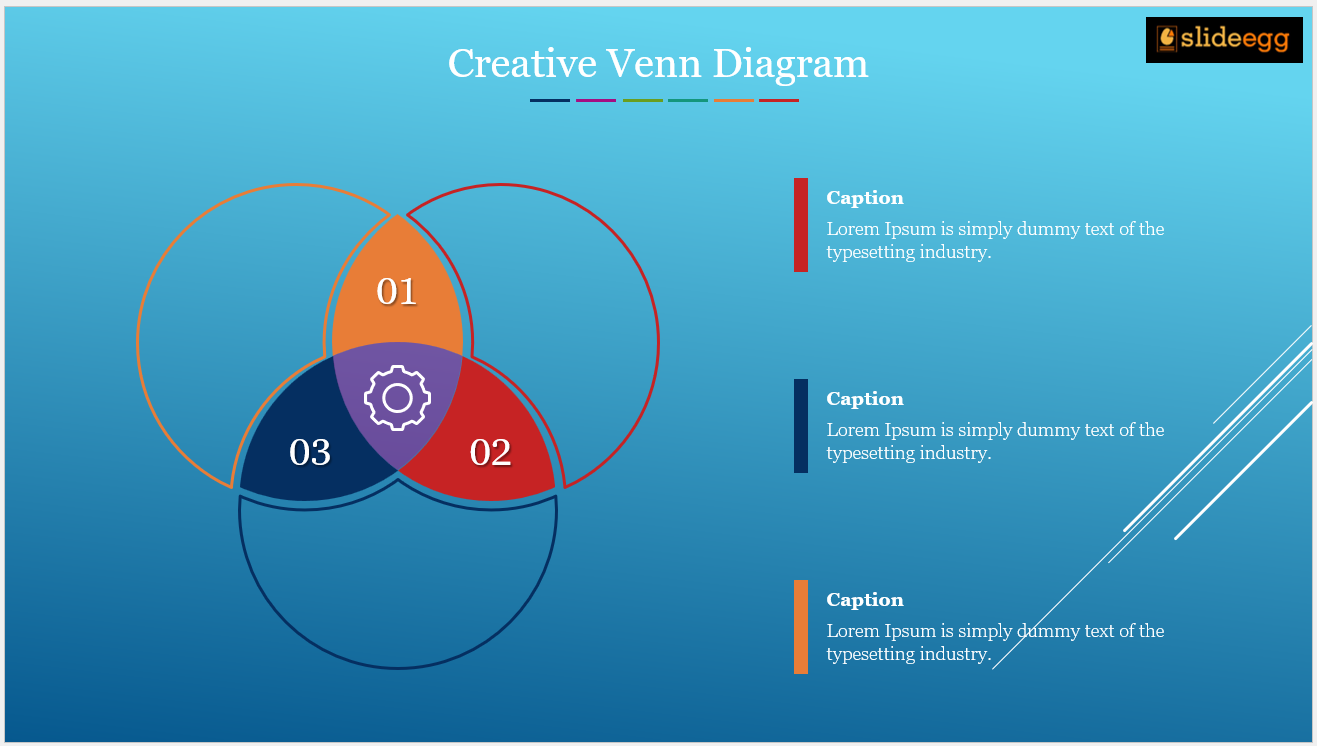
Venn diagrams, named after mathematician John Venn, are more than just overlapping circles. They’re a visualization technique that allows you to represent two or more sets of data and highlight the unique elements (represented by areas outside the circles) and the commonalities (represented by the overlapping area).
They’re perfect for:
- Comparing and contrasting features of products or services
- Highlighting differences and similarities between ideas and concepts
- Demonstrating relationships between categories or groups
- Illustrating cause-and-effect scenarios
Building Your Venn Diagram: A Step-by-Step Guide
There are two main approaches to creating a Venn diagram in Google Slides:
Method 1: Using the Shapes Tool (Manual Approach)
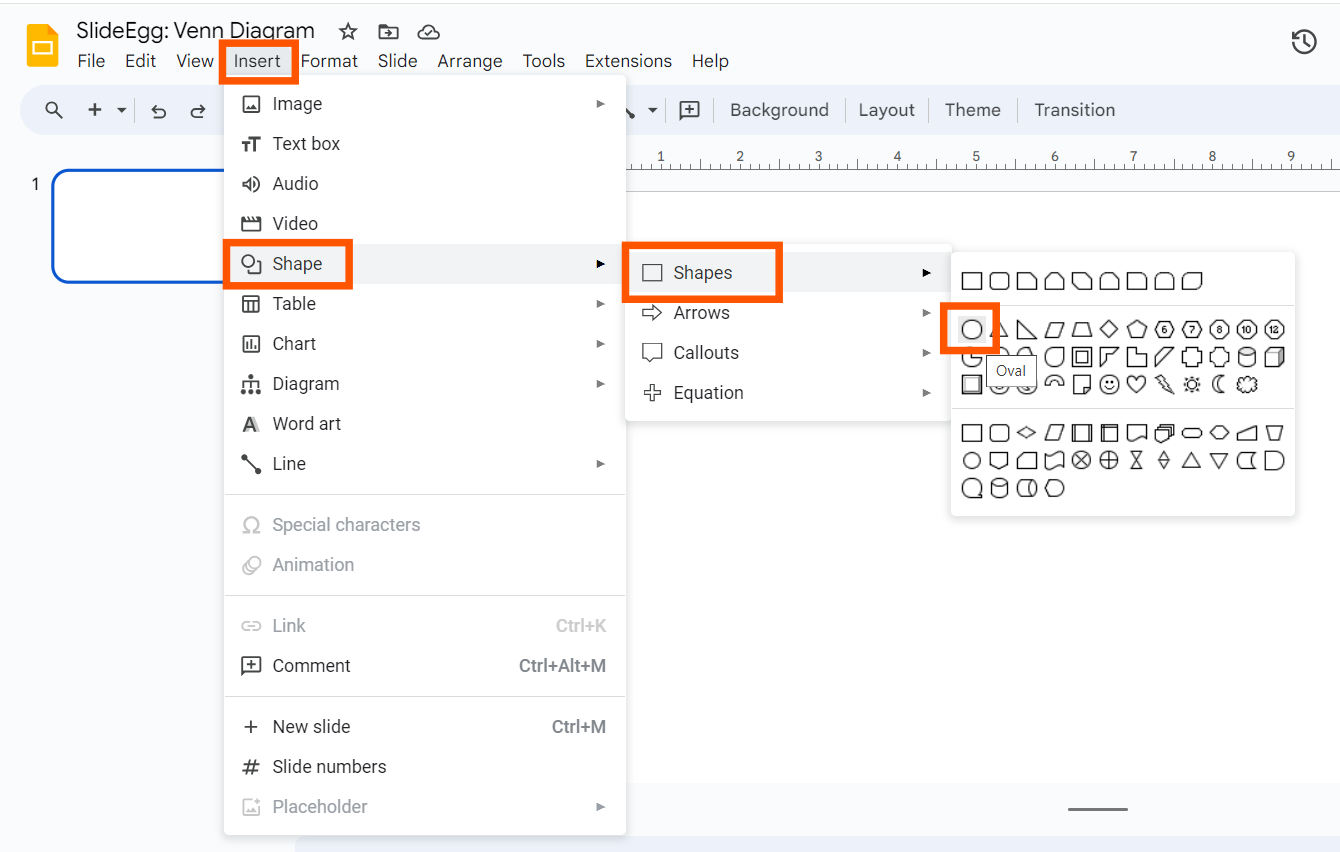
Step 1: Insert Your Circles
Head over to the “Insert” menu and select “Shapes.” Choose the “Ovals” option and start drawing circles on your slide. To create perfect circles, hold down the “Shift” key while dragging the oval shape.
Step 2: Create the Overlap between Your Circles.
Drag one circle slightly on top of the other. You can use the “Arrange” menu to bring specific objects forward or backward for precise positioning.
Step 3: Color Coordination
Let’s add some visual flair! Select each circle and choose a different fill color from the “Format” menu. Adjust the transparency a bit to make the overlapping area stand out.
Step 4: Labeling is Key
Now, it’s time to explain what each section represents. Use the “Text box” function to add labels within each circle and the overlapping area.
Method 2: Utilizing the Diagrams Feature (Faster Approach)
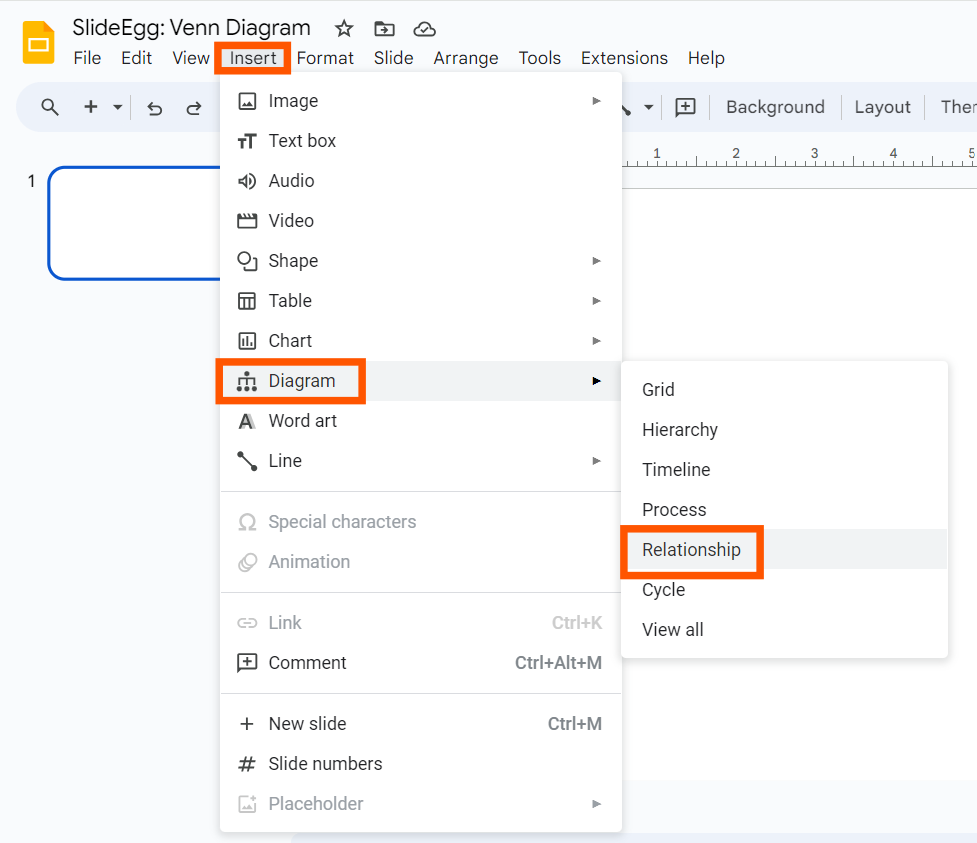
- Ready-Made Option: Click “Insert” and then “Diagrams.” In the right-hand panel, navigate to the “Relationships” category and choose the Venn diagram option.
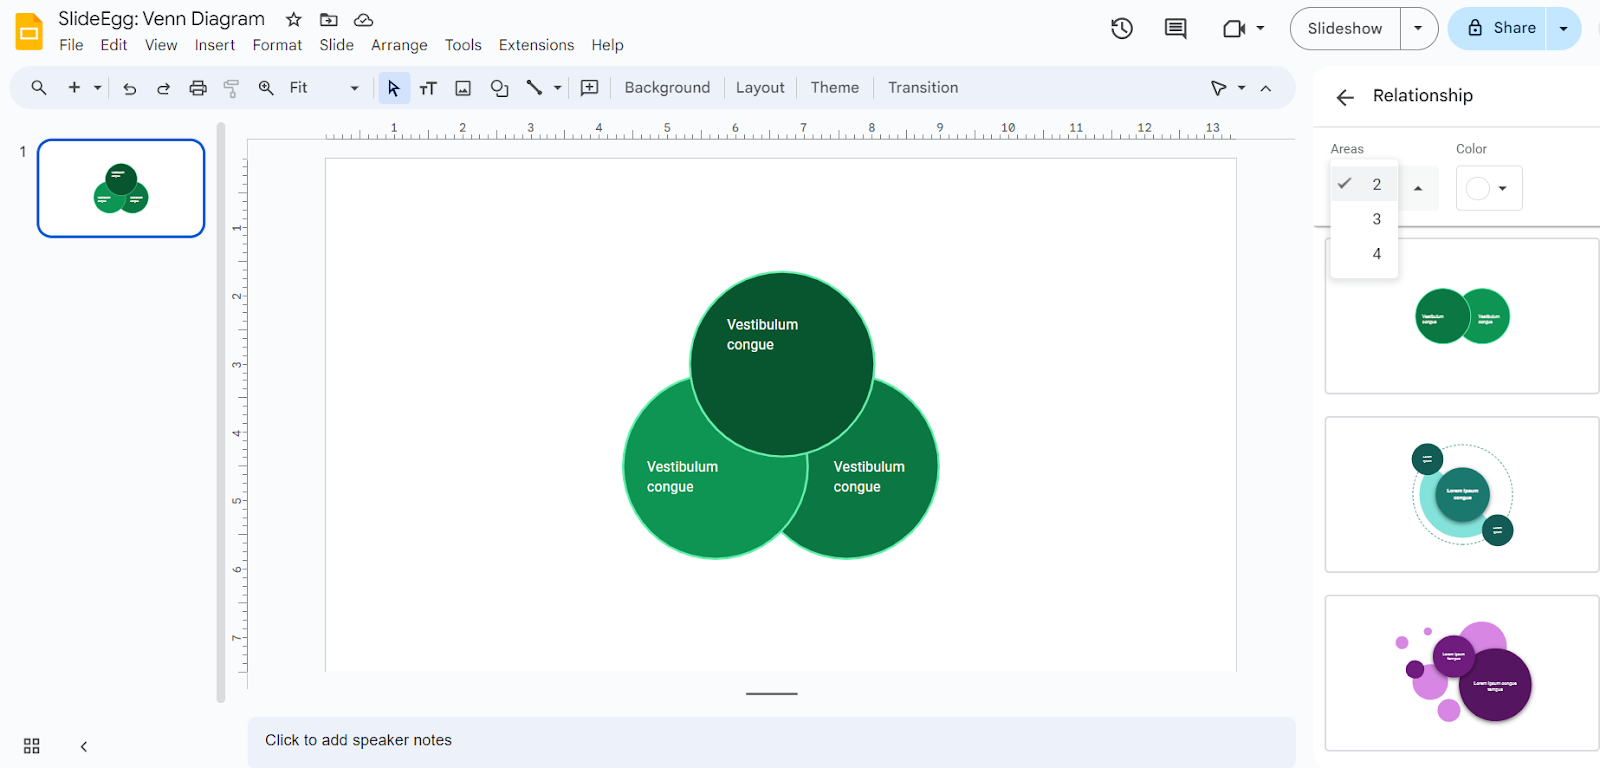
- Circle Selection: Google Slides offers you the flexibility to choose how many circles you need (two or three) from the “Areas” drop-down menu.
- Color Customization: Just like with the manual method, you can customize the colors and transparency of the pre-made Venn diagram using the “Format” menu.
- Text Box Time: Add your labels using the “Text box” function as described earlier.
Bonus Tip: Explore Pre-Made Venn Diagram Templates (Optional)
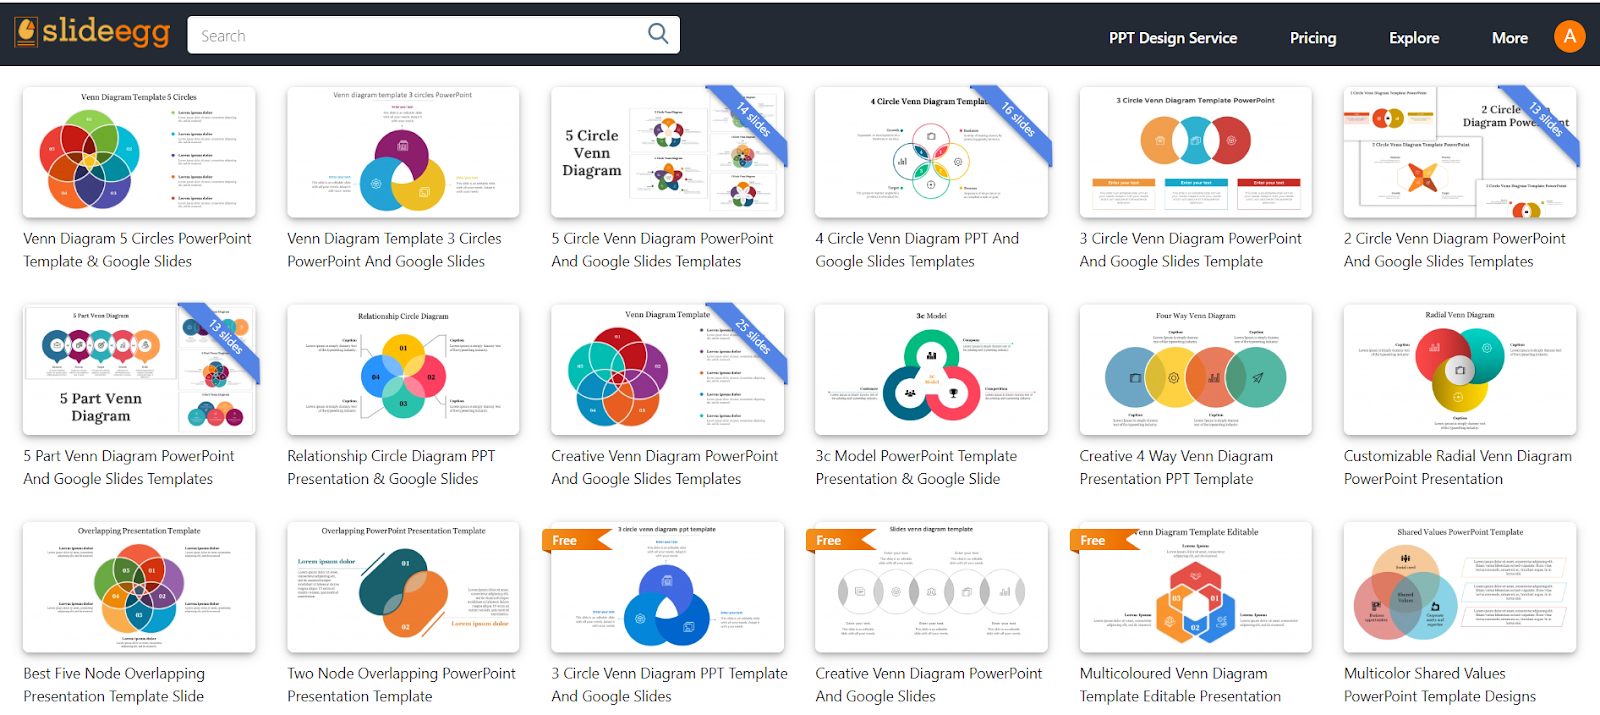
For an even faster solution, you can search for pre-made Venn diagram presentation templates online. These templates often come with customizable text boxes and color schemes, saving you valuable time.
Presentation Hacks for the Savvy Presenter
Feeling the creative spark? Dive deeper into the world of presentation design by exploring our Tips & Tricks page! You’ll find a treasure trove of hacks to make your slides truly shine. If you found this guide helpful, you might also want to check out our blog on How to Create a Venn Diagram in PowerPoint.
Conclusion: Venn-tastic Presentations Await!
Hope! With these simple steps, you’re now equipped to create compelling Venn diagrams in Google Slides. Remember, clarity and visual appeal are key. So, unleash your creativity, choose the method that best suits your needs, and get ready to wow your audience with impactful presentations!