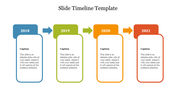
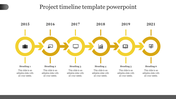
Free - Elegant Year Timeline PPT Diagram For Presentation
Free

 Canva
Canva
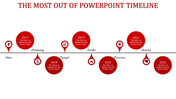
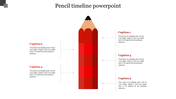
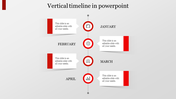
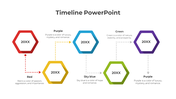
Red Timeline PPT Template
The timeline design with red color brings the best outcome in the presentation. The template is designed in a linear format with flags showing the years that handles the events in the order. The free template can be customized and can bring in more effect to the presentations with the topic details etched in the text area. So give this template a try and make it a success. Download now!
Features of the Template:
- 100% customizable slides and easy to download.
- The slide contains 16:9 and 4:3 formats.
- Slides are available in different nodes & colors.
- Easy to change the colors of the slide quickly.
- Well-crafted template with an instant download facility.
- Red color with text area.


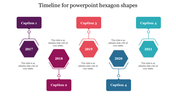
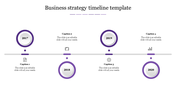
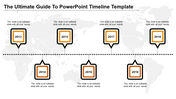
You May Also Like These PowerPoint Templates
Add to Wishlist
Download
Edit

Add to Wishlist
Download
Edit

Add to Wishlist
Download
Edit

Add to Wishlist
Download
Edit

Add to Wishlist
Download
Edit


Add to Wishlist
Download
Edit


Add to Wishlist
Download
Edit

Add to Wishlist
Download
Edit

Add to Wishlist
Download
Edit

Add to Wishlist
Download
Edit

Add to Wishlist
Download
Edit

Add to Wishlist
Download
Edit

Add to Wishlist
Download
Edit

Add to Wishlist
Download
Edit

Add to Wishlist
Download
Edit
