Use This Technology Presentation And Google Slides Template

Circular infographic with six segments showcasing technology icons, including robotics and electronics.
P.ID : 40092
    159 views
    62 Downloads
    Get Custom Slides by Experts
    Instantly Access Templates in PowerPoint

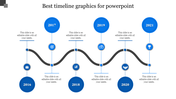
    Charming Blue And White Technology Theme Slide

    Technology PowerPoint Templates and Google Slides are great tools to design engaging, informative, and professional-looking presentations to talk about a range of contexts related to the tech industry. Try this elegant and innovative slide in your next seminar, workshop, or classroom presentation to deliver the latest trends and development in technology. It has a stunning layout with eye-grabbing graphics in pretty blue and white colors to make your slideshow mesmerizing. Get this six-noded slide right now!

    Features of the template

    • 100% customizable slides and easy to download.
    • Slides are available in different nodes & colors.
    • The slide contains 16:9 and 4:3 formats.
    • Easy to change the colors of the slide quickly.
    • Well-crafted template with an instant download facility.
    • Beautiful blue and white slide.
    Advertisement

    You May Also Like These PowerPoint Templates

    Add to Wishlist
    Download
    AI Customize
    Circular diagram with six colorful segment, surrounding a central white circle with an icon, on a dark background.
    Free
    Add to Wishlist
    Download
    AI Customize
    PowerPoint slide featuring a red circle infographic with four segments, each labeled with a caption and icon.
    Add to Wishlist
    Download
    AI Customize
    Business model slide featuring five interconnected circles with icons and captions for presentation.
    Free
    Add to Wishlist
    Download
    AI Customize
    Bubble chart at the center and smaller circles labelled with digital marketing channels like Facebook, YouTube, and Email.
    Add to Wishlist
    Download
    AI Customize
    Colorful diagram illustrating the PLM Framework, featuring eight key components around a central icon.
    Free
    Add to Wishlist
    Download
    AI Customize
    A business strategy timeline slide featuring a horizontal layout with years 2017, 2018, 2019, and 2020 with caption texts.
    Add to Wishlist
    Download
    AI Customize
    Six colored circles with years from 2000 to 2022, each circle connected with a dotted line, on a white background.
    Add to Wishlist
    Download
    AI Customize
    Circular process diagram slide with six colorful segments labeled from 01 to 06, surrounding the central text and captions.
    Add to Wishlist
    Download
    AI Customize
    Commercial Banking PowerPoint Template With Circle Design
    Add to Wishlist
    Download
    AI Customize
    Get attractive Process PPT Arrow PowerPoint Template
    Add to Wishlist
    Download
    AI Customize
    Six circular icons representing stages in supply chain management, including raw materials and retail, with captions areas.
    Add to Wishlist
    Download
    AI Customize
    Green circular infographic slide with five segments, each featuring icons and captions surrounding a central icon.
    Add to Wishlist
    Download
    AI Customize
    Circular segments numbered 01 to 04 in blue, orange, purple, and yellow, with text placeholders nearby.
    Free
    Add to Wishlist
    Download
    AI Customize
    Cloud computing infographic slide featuring a cloud graphic encircled by five orange icons symbolizing FTP and systems.
    Add to Wishlist
    Download
    AI Customize
    Four colored circles around a central icon, each numbered, with a list of customer types on the right side.
    Free
    Add to Wishlist
    Download
    AI Customize
    Four node circular diagram with red, purple, blue, and green circles arranged around a central ring structure.
    Add to Wishlist
    Download
    AI Customize
    a central planning circle, branching out into four different ideas, each in a unique color with three steps.
    Add to Wishlist
    Download
    AI Customize
    Harvey Circle diagram with five sections, each indicating a percentage from 20% to 80%, with caption areas.
    Add to Wishlist
    Download
    AI Customize
    Horizontal implementation timeline with milestones for 2018 to 2021 in blue, purple, red, and yellow circular nodes.