Our Predesigned PPT Cycle Diagram Slide Templates Design

 Canva
Canva
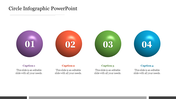
Creative Cycle Diagram PowerPoint Slides
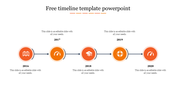
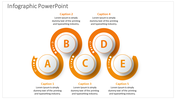
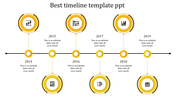
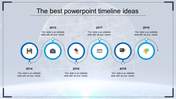
Introducing our Cycle Diagram Presentation Templates– your secret weapon for turning complex concepts into captivating visuals. These templates are like a magic wand for your presentations, making even the most intricate processes look simple. Whether you're explaining the water cycle to a curious kid or presenting a business strategy to seasoned professionals, our cycle diagram templates are your trusty sidekick. With user-friendly designs and a dash of creativity, you can illustrate workflows, timelines, or any cyclical process effortlessly. Embrace clarity, flow, and engagement in your presentations. Pick a template, add your content, and voilà – you're a visual storytelling pro. Get ready to cycle through success with these templates!
Features of this template:
- 100% customizable slides and easy to download.
- Slides available in different nodes & colors.
- The slide contained 16:9 and 4:3 format.
- Easy to change the slide colors quickly.
- Well-crafted template with instant download facility.


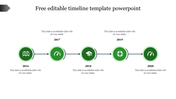
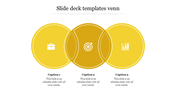
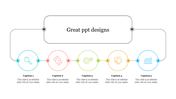
You May Also Like These PowerPoint Templates
Add to Wishlist
Download
Edit

Add to Wishlist
Download
Edit

Add to Wishlist
Download
Edit


Add to Wishlist
Download
Edit


Add to Wishlist
Download
Edit

Add to Wishlist
Download
Edit

Add to Wishlist
Download
Edit

Add to Wishlist
Download
Edit

Add to Wishlist
Download
Edit

Add to Wishlist
Download
Edit


Add to Wishlist
Download
Edit

Add to Wishlist
Download
Edit


Add to Wishlist
Download
Edit

Add to Wishlist
Download
Edit
