2700+ Process Presentation Templates

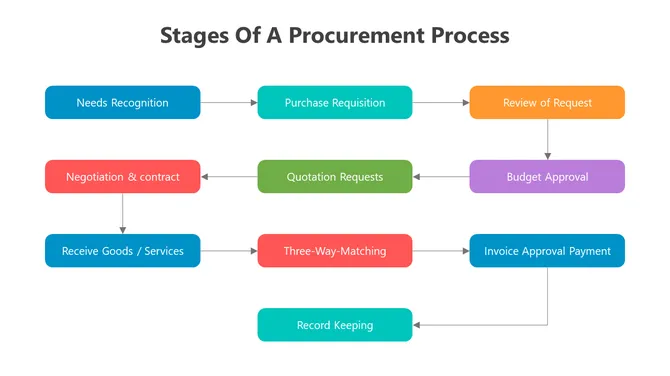
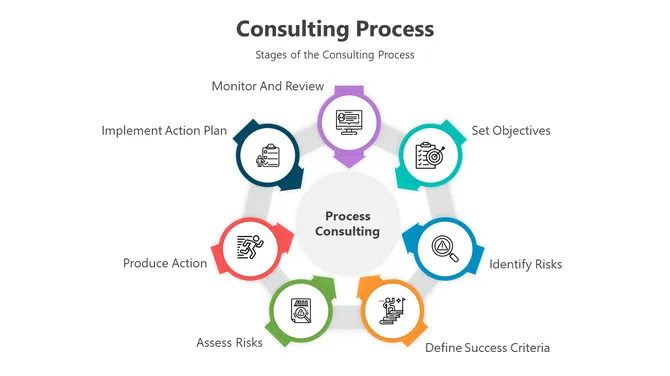
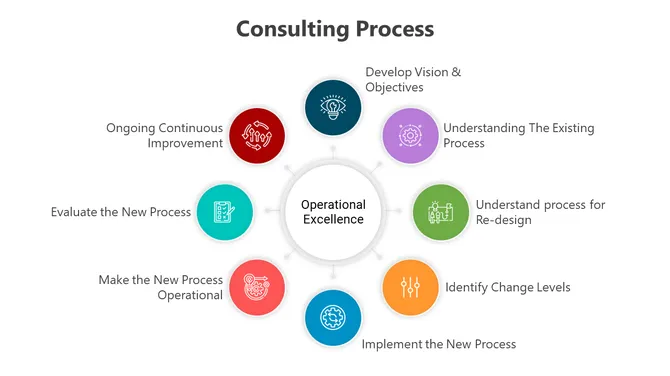
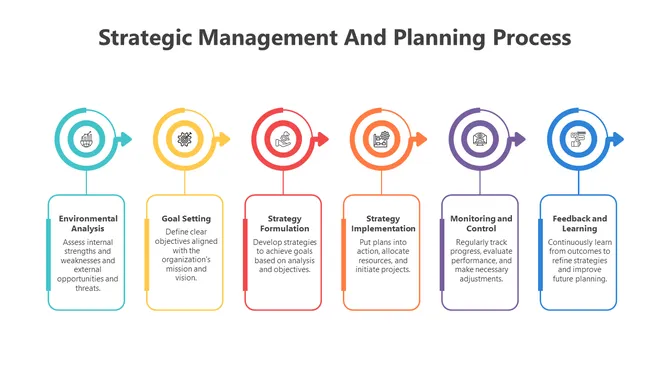
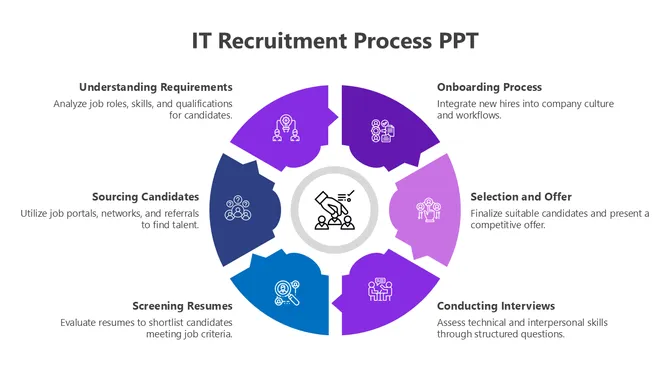
Explaining processes with words is hard. People hear the steps but don't see how they fit together. Process diagrams organize your workflow visually. Arrows show flow. Stages are clear. Everyone understands the same thing.
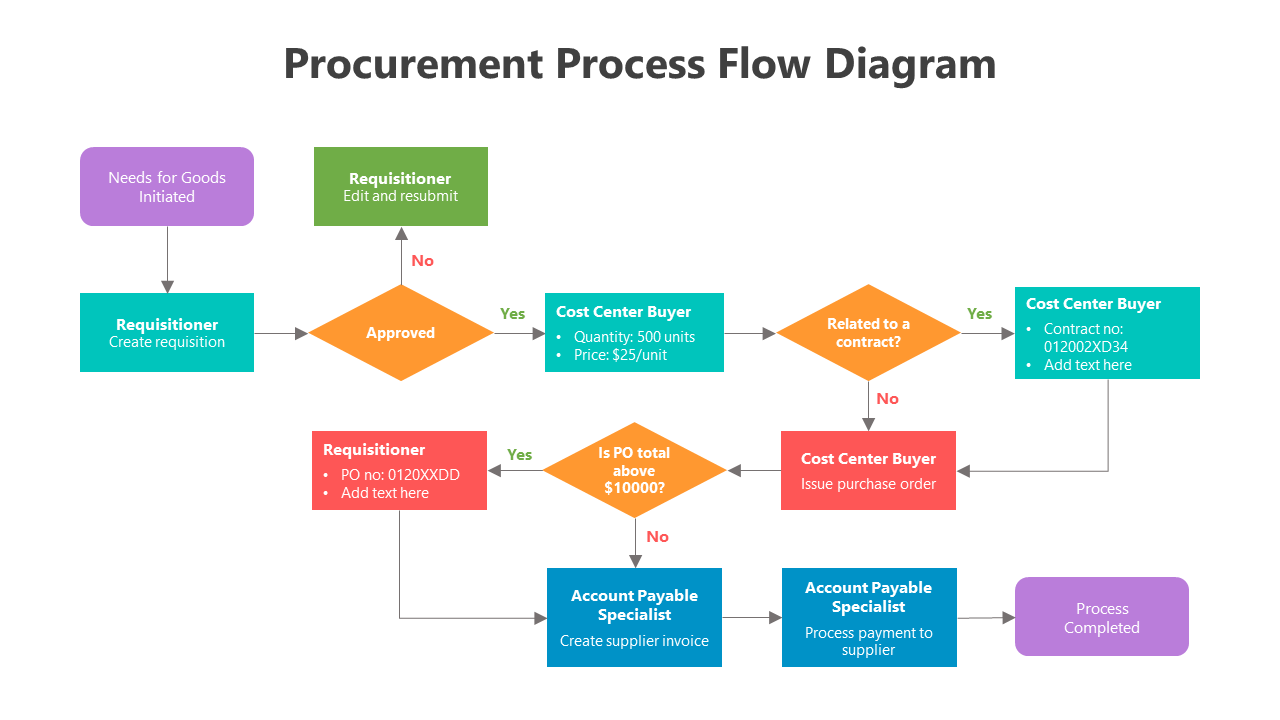
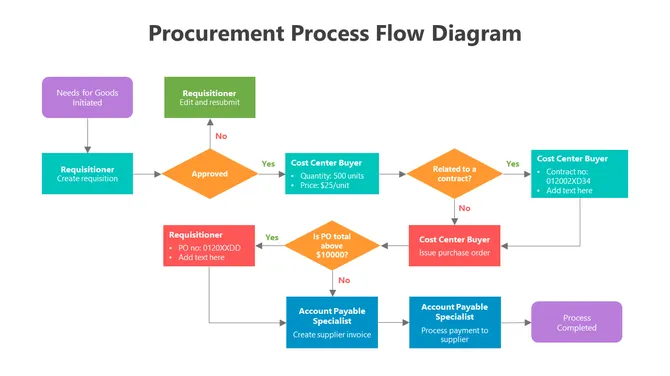
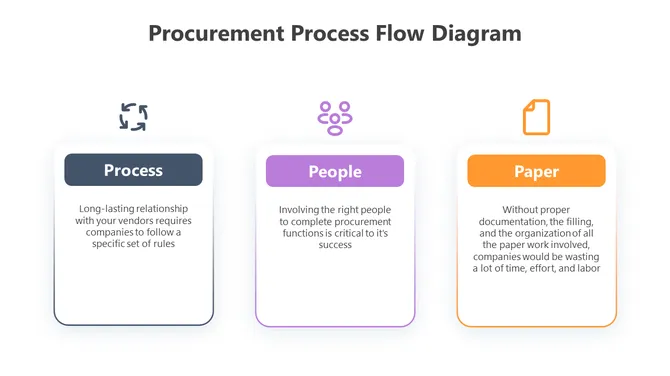
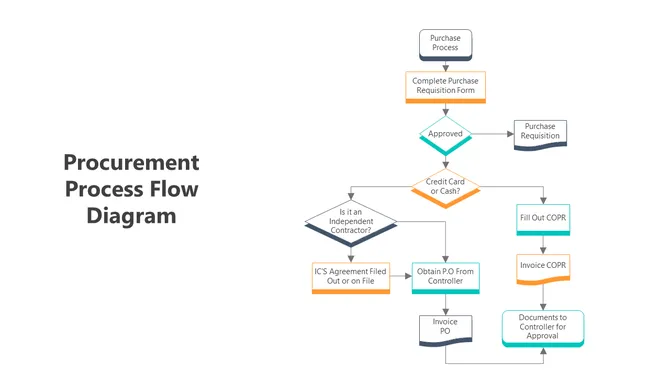
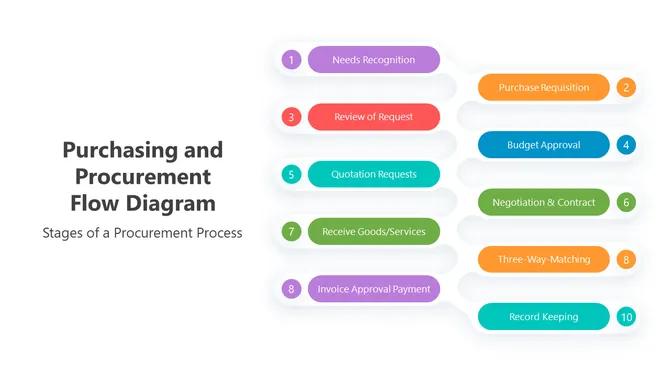
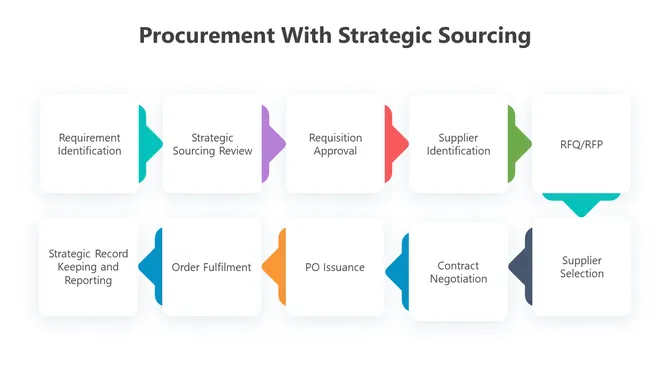
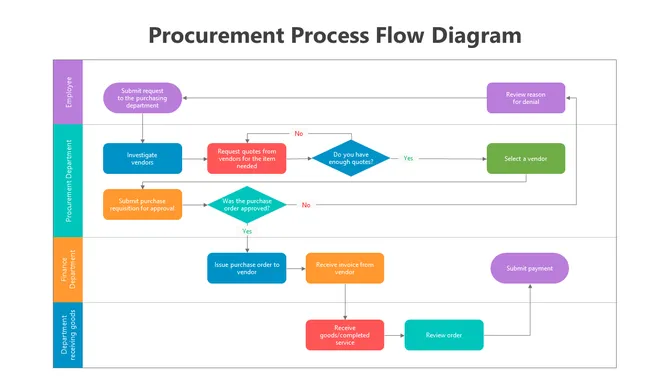
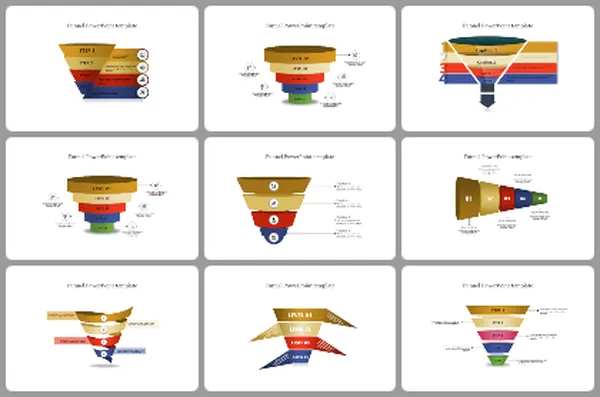
Got a Unique Idea? Craft with AI
PRO
Credits left : 0
Add to Wishlist
Download
AI Customize
Professional outline slides with colorful icons and text boxes, structured to organize key points of a presentation.
Add to Wishlist
Download
AI Customize
Five-week transition plan slide with a sequence of colored linked boxes and text, each representing the project stage.
Add to Wishlist
Download
AI Customize
A pack of slides with colorful layouts showing challenges to result with arrows connecting each stage and text below.
Add to Wishlist
Download
AI Customize
Collection of process flow slides showcasing different step by step diagram designs in various styles and colors.
Add to Wishlist
Download
AI Customize
Sales process flowchart template with stages from prospecting to closing, connected by dotted lines, with color-coded icons.
Add to Wishlist
Download
AI Customize
Flowchart slide illustrating the communication process with many steps in colored boxes.
Add to Wishlist
Download
AI Customize
Overview of multiple 3-step slide designs, each displaying with diverse layouts and color themes with icons and text area.
Add to Wishlist
Download
AI Customize
Process flow diagram in a snake shape with colorful segments, numbered steps, and  caption areas.
Add to Wishlist
Download
AI Customize
Phased approach slide showing a sequence of four steps, each with a colored box with phase number, headline, and text.
Add to Wishlist
Download
AI Customize
Illustrative SmartArt Cycle slide with numbered segments from 01 to 05, each icon accompanied by a placeholder caption text.
Add to Wishlist
Download
AI Customize
Flywheel PPT slide displaying a colorful circular model illustrating a business strategy with icons and text captions.
Add to Wishlist
Download
AI Customize
Circular diagram of behavioral theory showcasing the interaction between stimulus, learner response, and reinforcement.
Add to Wishlist
Download
AI Customize
Stage gate process diagram showing six colored phases with placeholder text.
Add to Wishlist
Download
AI Customize
Horizontal row of blue to green water drop icons, with a watering can, each drop having a caption area beneath.
Add to Wishlist
Download
AI Customize
Circular infographic slide on regulatory compliance with six sections for text, featuring color coded icons.
Add to Wishlist
Download
AI Customize
Best Design Thinking Slides PowerPoint Presentation Slide
Add to Wishlist
Download
AI Customize
Four part cycle diagram in red, purple, green, and orange, each with icons and captions on both sides.
Add to Wishlist
Download
AI Customize
A pack of ADDIE model slides outlining five phases with different colorful layout designs and icons with text descriptions.
Add to Wishlist
Download
AI Customize
Curved snake like diagram with segments in orange, green, blue, purple, pink, and yellow, with years from 2017 to 2022.

Related Collections

Frequently Asked Questions

1. How do I choose which process to visualize first?

Start with the process that causes the most confusion or problems. Hiring? Customer onboarding? Manufacturing? Pick the one where miscommunication costs you time or errors. Visualize that first. Success there builds momentum for other processes.

2. What should every process diagram include?

Start point and end point. All major steps in order. Decision points (yes/no branches). Who does what at each step. How long each step takes. Where handoffs happen between people or departments. A clear visual makes these elements obvious.

3. How do I explain my process to new team members clearly?

Walk them through the visual diagram step by step. Point to each stage. Explain what happens and why. Have them trace the flow themselves. Ask questions to check understanding. Visuals speed up training because people see the whole picture before diving into details.

4. What's the best way to show process bottlenecks or problems?

Use color coding: green for smooth steps, yellow for slow steps, red for bottlenecks. Or add timing to each step — if it takes too long, flag it. Visual bottlenecks are obvious. Then you can discuss solutions with data, not opinions.

5. Should I include every tiny detail in my process diagram?

No. Include decision points and major steps. Skip minor tasks that happen within a step. Too much detail creates confusion, not clarity. Your diagram should be readable in 2-3 minutes, not require a manual to understand.

6: How do I update a process diagram when the workflow changes?

Document what changed and why. Update the diagram. Share it with everyone affected. Make it a habit to review processes quarterly. When processes change but diagrams don't, confusion returns. Keep visuals current.

7. How do I get buy-in for a new process from my team?

Show them the current process visually. Show them the new process visually. Point out differences. Explain why each change improves things. Let them ask questions. Visuals make the "before and after" obvious, so people understand the reasoning.