Israel Map Of Population PowerPoint And Google Slides

Israel Map Of Population Presentation Slides
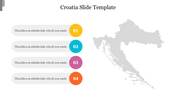
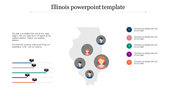
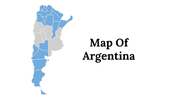
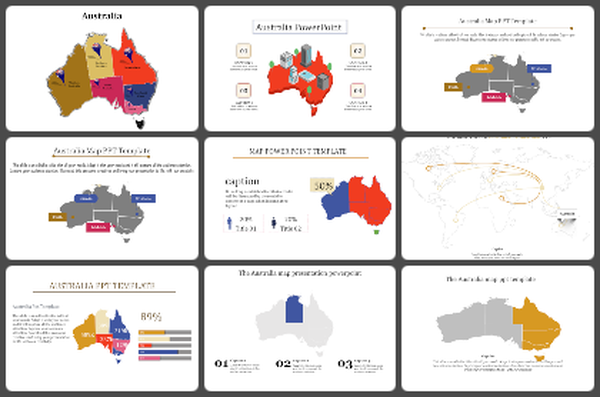
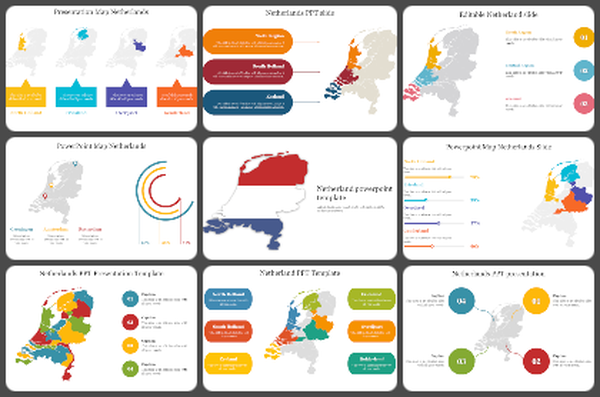
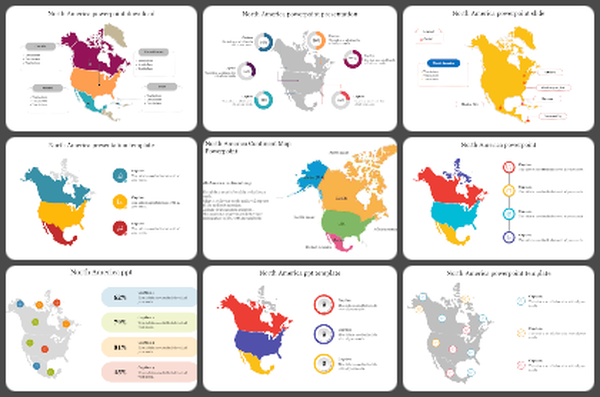
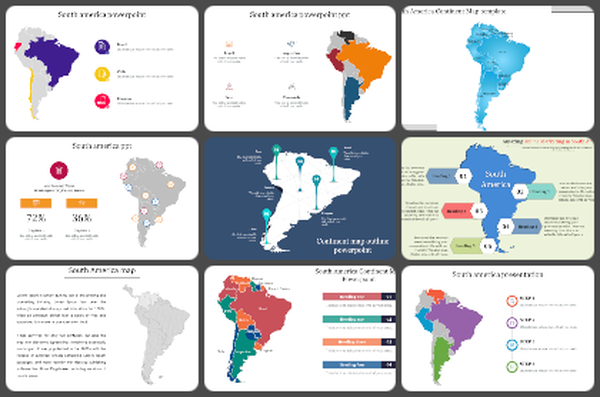
Delve into an insightful PowerPoint template, the israel map of Population, designed to provide an engaging and informative snapshot of Israel's demographic landscape. This unique concept allows you to showcase population distribution, density, and key statistics, empowering educators, researchers, analysts, and professionals to present an in-depth view of Israel's residents and their geographical distribution. It's a valuable resource for those interested in exploring demographic trends and insights, aiding education, research, and business decision-making. With fully editable slides, it offers a versatile platform to customize your content, enhancing the visual appeal and impact of your presentations. We wholeheartedly encourage you to utilize this template, creating compelling, data-driven presentations that captivate your audience and facilitate a deeper understanding of Israel's demographic landscape, ensuring your data comes to life and leaves a lasting impression.
Features of the template:
- 100% customizable slides and easy to download.
- Slides are available in different nodes & colors.
- The slide contained 16:9 and 4:3 formats.
- Easy to change the slide colors quickly.
- It is a well-crafted template with an instant download facility.
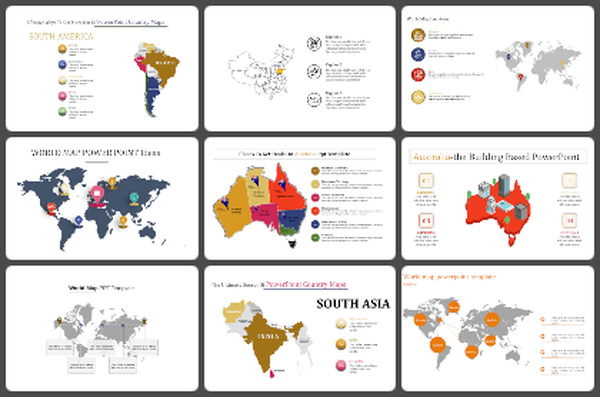
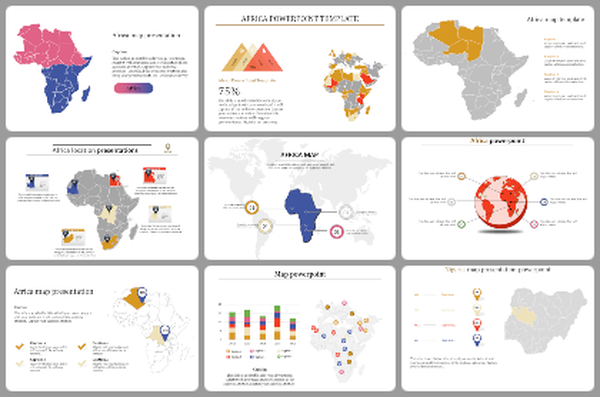
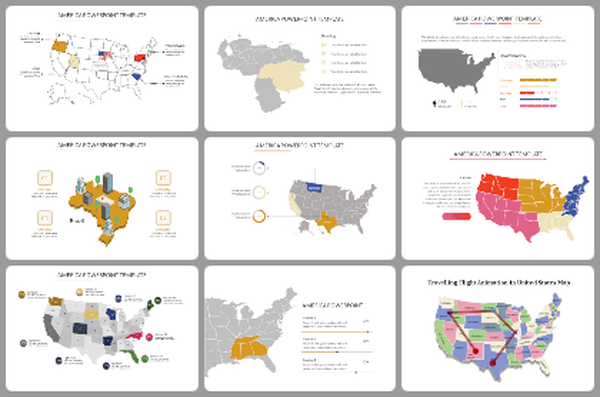
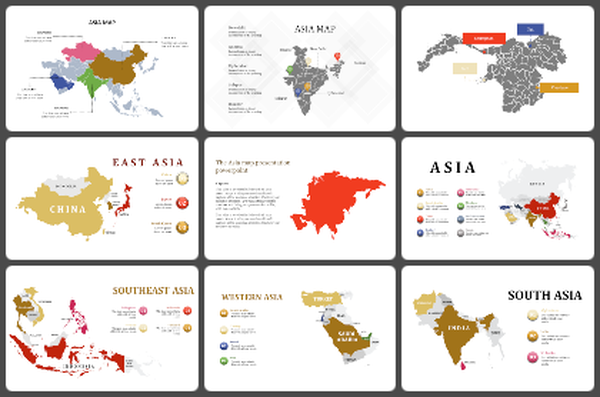
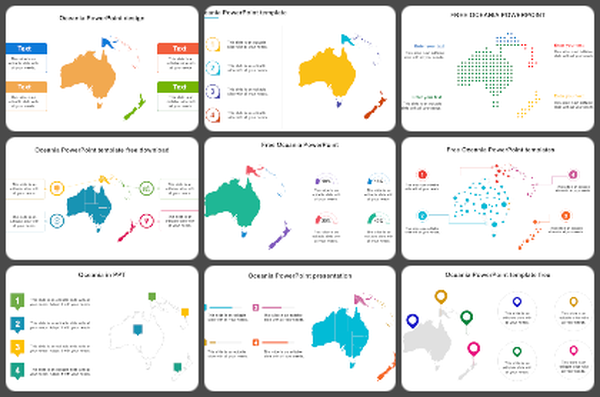
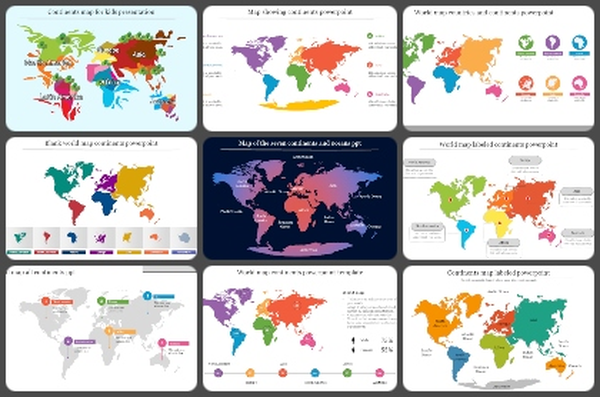
You May Also Like These PowerPoint Templates
Add to Wishlist
Download
AI Customize

Add to Wishlist
Download
AI Customize

Add to Wishlist
Download
AI Customize

Add to Wishlist
Download
AI Customize

Add to Wishlist
Download
AI Customize


Add to Wishlist
Download
AI Customize

Add to Wishlist
Download
AI Customize

Add to Wishlist
Download
AI Customize

Add to Wishlist
Download
AI Customize

Add to Wishlist
Download
AI Customize

Add to Wishlist
Download
AI Customize

Free
Add to Wishlist
Download
AI Customize

Add to Wishlist
Download
AI Customize

Add to Wishlist
Download
AI Customize

Add to Wishlist
Download
AI Customize

Add to Wishlist
Download
AI Customize

Add to Wishlist
Download
AI Customize

Add to Wishlist
Download
AI Customize

Add to Wishlist
Download
AI Customize
