Effective Infographic Presentation With Four Nodes Slide

Infographic Presentation Templates and Google Slides
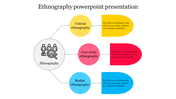
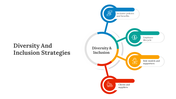
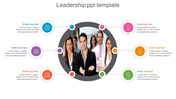
In the dynamic landscape of presentations, the infographic presentation stands out as a beacon of creativity and professionalism, seamlessly blending information and aesthetics. Crafted with a hexagon design and four nodes, each element strategically placed to engage and captivate audiences. Its utilization of professional blue shades not only adds a touch of sophistication but also enhances comprehension and retention. From boardrooms to classrooms, this presentation infographic serves as a versatile tool, transforming complex data into visually compelling narratives. Whether elucidating business strategies or educational concepts, its human-centric approach resonates, fostering deeper connections and understanding. Embrace the power of the infographic presentation – where innovation meets impact, and information transcends boundaries.
Features of the template
- 100% customizable slides and easy to download.
- Slides are available in different nodes & colors.
- The slides contain 16:9 and 4:3 formats.
- Easy to change the colors quickly.
- It is a well-crafted template with an instant download facility.


You May Also Like These PowerPoint Templates
Add to Wishlist
Download
AI Customize

Add to Wishlist
Download
AI Customize

Add to Wishlist
Download
AI Customize

Add to Wishlist
Download
AI Customize

Add to Wishlist
Download
AI Customize

Add to Wishlist
Download
AI Customize

Add to Wishlist
Download
AI Customize

Add to Wishlist
Download
AI Customize

Add to Wishlist
Download
AI Customize

Add to Wishlist
Download
AI Customize

Add to Wishlist
Download
AI Customize

Add to Wishlist
Download
AI Customize

Add to Wishlist
Download
AI Customize

Add to Wishlist
Download
AI Customize

Add to Wishlist
Download
AI Customize

Add to Wishlist
Download
AI Customize

Add to Wishlist
Download
AI Customize

Add to Wishlist
Download
AI Customize

Add to Wishlist
Download
AI Customize

Add to Wishlist
Download
AI Customize
