Data Modeling PowerPoint Presentation And Google Slides


 Canva
Canva
Data Modeling PowerPoint, Google Slides, and Canva Template
Make your data stories clear, structured, and powerful with this Data Modeling presentation template. Designed with a clean blue color theme and fully editable shapes, this template helps you explain complex data concepts in a simple and visual way. Whether you are presenting to business teams, students, or stakeholders, this deck makes data modeling easy to understand.
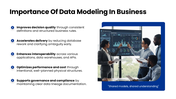
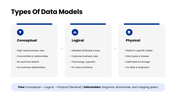
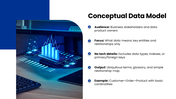
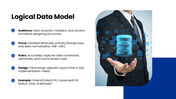
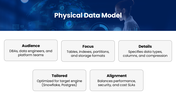
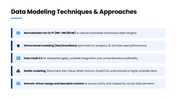
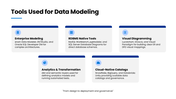
This template covers every important area of data modeling, including conceptual, logical, and physical models, data architecture, data flow, and modeling techniques. With well-organized slides and smart visual layouts, you can present business intelligence, data analysis, database design, and analytics processes clearly and confidently.
If you want to turn raw data into meaningful insights, this template is your perfect tool. Download now and create professional, insightful presentations that your audience will understand and remember.
Features of this template
- 100% customizable slides and easy to download.
- The slides contain 16:9 and 4:3 formats.
- Easy to change the colors quickly.
- Highly compatible with PowerPoint, Google Slides, and Canva templates.

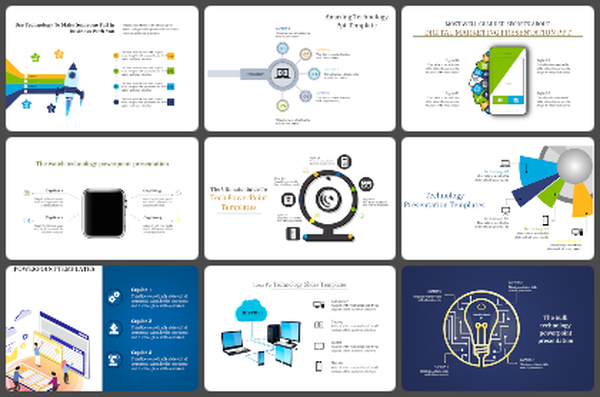
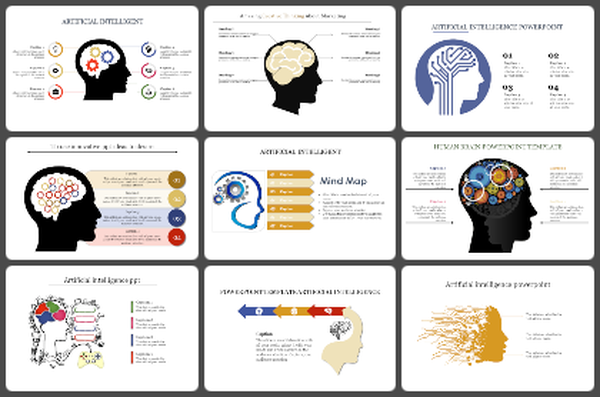

You May Also Like These PowerPoint Templates


