Colorful Circle Infographic PowerPoint Presentation Template

Circle Infographic Presentation Template
Enhance your presentations with our Circle Infographic PowerPoint presentation template, designed to captivate and inform.
Slide Description:
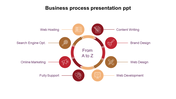
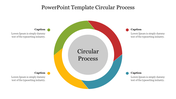
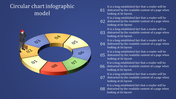
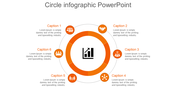
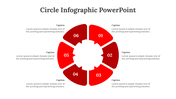
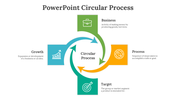
Our slide features a circular infographic design. It consists of five colored circles connected by lines to a central circle.
Purpose of this slide:
It simplifies complex content by breaking it down into digestible segments. The circular layout emphasizes interrelated concepts or processes.
Who can benefit?
Professionals, educators, and students who need to convey interconnected ideas. Business presenters, marketers, and educators can use it effectively. Anyone seeking a balanced, visually appealing way to showcase data or concepts.
How can users benefit from this template?
Provides a structured layout for clear communication. Encourages visual learning and engagement. Allows customization with placeholders for content.
Download now!
Features of the template:
- Slides are available in 4:3 & 16:9
- Well-crafted template with instant download.
- Get slides that are 100% customizable and easy to download


You May Also Like These PowerPoint Templates

Add to Wishlist
Download
Edit

Add to Wishlist
Download
Edit

Add to Wishlist
Download
Edit

Add to Wishlist
Download
Edit

Add to Wishlist
Download
Edit

Add to Wishlist
Download
Edit

Add to Wishlist
Download
Edit


Add to Wishlist
Download
Edit

Add to Wishlist
Download
Edit

Add to Wishlist
Download
Edit


Add to Wishlist
Download
Edit

Add to Wishlist
Download
Edit
Add to Wishlist
Download
Edit
Add to Wishlist
Download
Edit

Add to Wishlist
Download
Edit


