Comprehensive Business Process Flow Diagram Templates


Business Process Flow Diagram Templates and Google Slides Themes
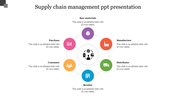
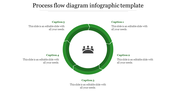
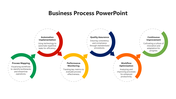
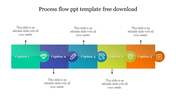
Boost your business with Business Process Flow Diagram Templates. With seven orange nodes in a vertical layout on a clean white background, these templates make it easy to visualize and improve your workflows.
What is so best about our slide?
Our Business Process Flow templates are slides that show how your business processes work. They break down complex tasks into simple steps, helping you understand and improve your workflow.
Purpose of the Slide
The main point of this slide is to help you see your business processes in a clear way. By showing each step in order, these templates make it easy to find ways to work better and faster.
Who Can Use These Templates?
Anyone can use these templates to make their business better! Whether you're a project manager, business analyst, student, or entrepreneur, these templates can help you understand and improve your processes.
With our templates, you can see your processes clearly and find ways to make them work better. Don't wait – get started now!
Features of the template
- 100% customizable slides and easy to download.
- Slides are available in different nodes & colors.
- The slide contains 16:9 and 4:3 formats.
- It is easy to change the colors of the slide quickly.
- Well-crafted template with an instant download facility.


You May Also Like These PowerPoint Templates
Add to Wishlist
Download
Edit

Add to Wishlist
Download
Edit


Add to Wishlist
Download
Edit


Add to Wishlist
Download
Edit

Add to Wishlist
Download
Edit

Add to Wishlist
Download
Edit

Add to Wishlist
Download
Edit

Add to Wishlist
Download
Edit

Add to Wishlist
Download
Edit

Add to Wishlist
Download
Edit


Add to Wishlist
Download
Edit


Add to Wishlist
Download
Edit
