B2B Marketing PowerPoint slide

Circular infographic with six colorful arrows representing B2B marketing trends, each linked to icon and description.
P.ID : 48367
    451 views
    44 Downloads
    Get Custom Slides by Experts
    Instantly Access Templates in PowerPoint

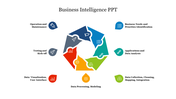
    Astounding B2B Marketing PowerPoint Template

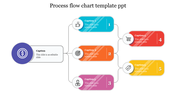
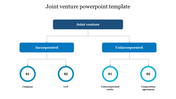
    In today's marketing revolution, it pays to have access to different methods for B2B. These B2B marketing styles are deals between a business and another unit in that same business. Download this slide template to explain the innovative marketing tactics you've used lately, and let us add some design touches so you can present your slideshow effectively to colleagues. Get the six nodded facility in making your points so short and understanding. Download the colorful slide and make your day in the sun for your next presentation. Step up your business game now!

    Features of the template

    • 100 % customizable slides and easy to download.
    • Slides are available in different colors
    • The slide has 4:3 and 16:9 formats.
    • Easy to change the slide colors quickly.
    • Appealing presentation to impress an audience.
    • Create feature-rich slide presentations. 
    • An eye-pleasing color slide helps to give a catchy presentation.
    • Crisp and clear font styles.
    • Six nodded interconnected designs.
    Advertisement

    You May Also Like These PowerPoint Templates

    Add to Wishlist
    Download
    AI Customize
    Circular flywheel diagram with four colored sections in orange, green, purple, and yellow, centered around customer icon.
    Free
    Add to Wishlist
    Download
    AI Customize
    Colorful phased approach slide showing five phases from initiation to closing, with process steps below.
    Add to Wishlist
    Download
    AI Customize
    Five colored square boxes, each with number and captions, linked by a dashed line.
    Free
    Add to Wishlist
    Download
    AI Customize
    Four rectangular shapes in blue outline with icons in curved arrows above and captions below.
    Add to Wishlist
    Download
    AI Customize
    A slide layout displaying essential elements for managing entity level controls, highlighted by vibrant colored icons.
    Add to Wishlist
    Download
    AI Customize
    Slide deck showcasing various process infographics in vibrant layouts, including flow charts and hexagonal designs.
    Add to Wishlist
    Download
    AI Customize
    Diagram illustrating a framework of grounded theory in four steps, with arrows connecting analysis processes and factors.
    Add to Wishlist
    Download
    AI Customize
    PowerPoint slide illustrating customer touch points, featuring a flowchart of six stages from commitment to loyalty.
    Add to Wishlist
    Download
    AI Customize
    Transition slide displaying five tracks with check marks, illustrating progress in a linear format.
    Add to Wishlist
    Download
    AI Customize
    Illustration of the butterfly life cycle showing stages from caterpillar, to adult butterfly on a floral background.
    Add to Wishlist
    Download
    AI Customize
    Colorful pie chart with eight numbered sections representing business buying steps, with labels around it.
    Add to Wishlist
    Download
    AI Customize
    Effective Operations Management PPT  & Google Slides
    Add to Wishlist
    Download
    AI Customize
    Five interconnected circles with arrows showing from enterprise purpose up to management system each with a caption area.
    Add to Wishlist
    Download
    AI Customize
    Slide with blue to green gradient wave shaped infographic with five sections numbered 01 to 05, each with icon and text.
    Add to Wishlist
    Download
    AI Customize
    Flowchart with colorful icons, illustrating key stages of grounded theory research along a vertical arrow.
    Add to Wishlist
    Download
    AI Customize
    Customer types slide showing categories decision maker, economic buyer, recommender, influencer, and end user.
    Add to Wishlist
    Download
    AI Customize
    Five step value chart with red, orange, yellow, green, and teal boxes, depicting value and delay in each stage.
    Add to Wishlist
    Download
    AI Customize
    Circular chart with eight segments, each labeled with different emotions, and caption areas arranged in a wheel pattern.
    Add to Wishlist
    Download
    AI Customize
    A sequence of five diamond shaped icons with corresponding colored text boxes, forming a linear diagram.
    Add to Wishlist
    Download
    AI Customize
    Infographic of five colored connected circular steps in a horizontal line, displaying numbered steps with captions below.