Introduction
Root Cause Analysis (RCA) is a critical problem-solving method in business, education, and operations. One of the most effective tools for RCA is the Fishbone Diagram, also known as the Ishikawa Diagram or Cause-and-Effect Diagram. It helps teams visualize the causes of a specific issue, break them down into categories, and discover actionable insights.
In this blog, we’ll explore the best Fishbone PowerPoint templates. These templates are designed to save time, enhance clarity, and make presentations visually engaging. Whether you’re a project manager, quality analyst, teacher, or student, these templates can simplify your analysis and improve communication.
What is a Fishbone Diagram?
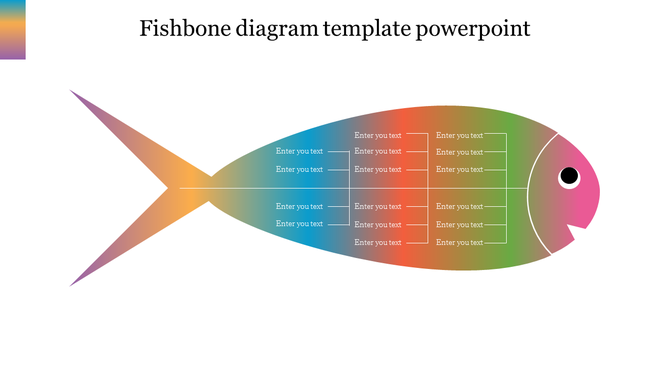
A Fishbone Diagram is a visual tool used to identify the root causes of a problem. The structure resembles a fish skeleton: the “head” represents the problem, while the “bones” branch off into different cause categories such as People, Process, Equipment, Environment, Materials, and Management.
This format is especially useful when:
- Brainstorming in teams
- Identifying problems in processes or projects
- Preparing quality improvement reports
- Teaching analytical thinking in classrooms
Why Use Fishbone PowerPoint Templates?
While creating a Fishbone diagram from scratch is possible, it can be time-consuming and challenging to format neatly. A pre-designed template provides:
- Professional Layouts: Ready-to-edit diagrams with balanced structure
- Customization: You can adjust categories, colors, fonts, and icons easily
- Clarity: Clean design keeps the focus on problem-solving
- Speed: Save time by using pre-built diagram frameworks
Tip: All SlideEgg templates are 100% editable and come with multiple layout options, ideal for PowerPoint beginners and pros.
Top Fishbone PowerPoint Templates
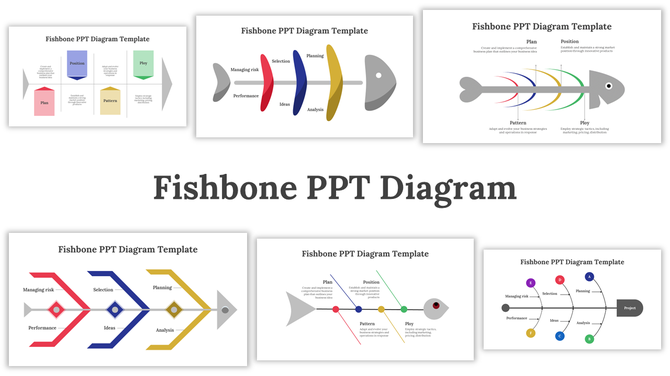
1. Minimalist Fishbone Diagram Template
This clean and straightforward design works well for formal business reports. It uses a monochrome color palette and includes editable text fields for each cause category.
Best For: Operations reports, strategy meetings, audits
Features:
- Fully editable
- Clearly segmented bones
- Space for conclusion or summary
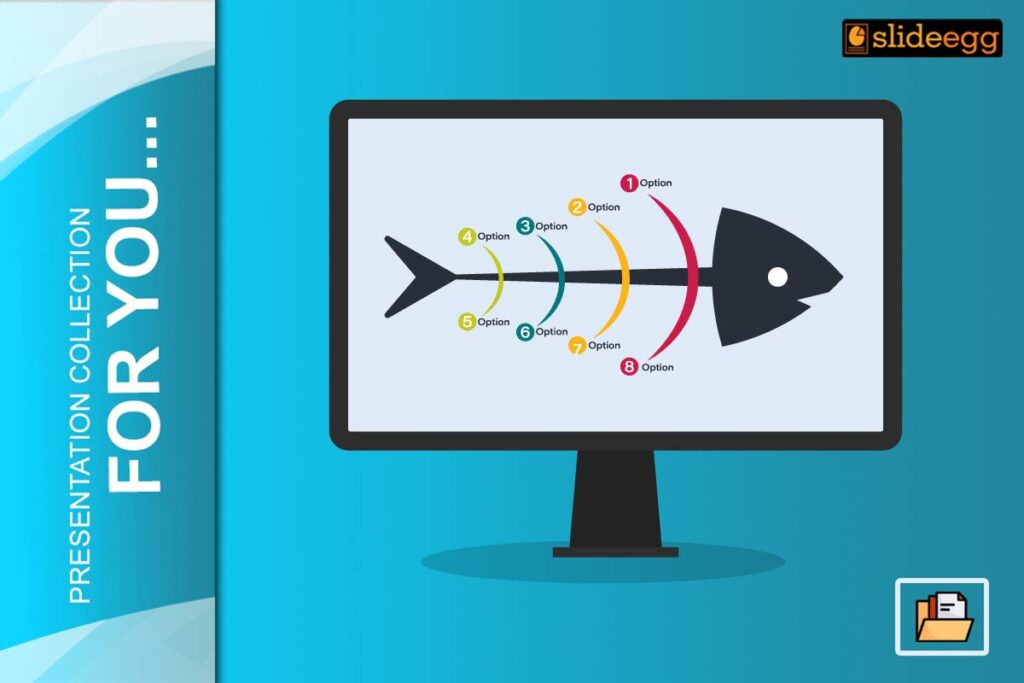
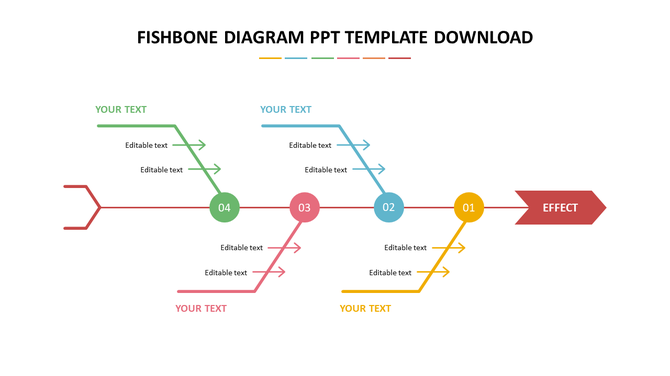
2. Color-Coded Fishbone Template
Colors can make analysis easier to follow. This template uses vibrant hues to separate causes, making it great for presentations that require interaction or feedback.
Best For: Workshops, classroom use, brainstorming sessions
Features:
- Visually engaging color scheme
- Icons for each cause
- Space for actionable insights
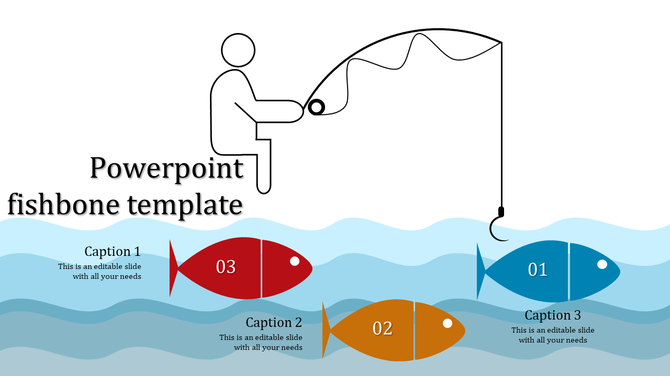
3. Fishbone with Icons Template
Icons help reinforce meaning and grab attention. This template uses modern flat icons alongside each category for instant visual clarity.

Best For: Quality improvement teams, health & safety reports
Features:
- Modern visual style
- Includes 6–8 cause branches
- Compact design for summary slides
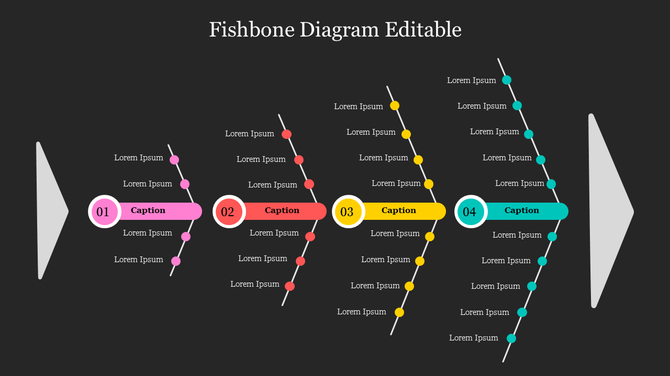
4. Editable Multi-Slide Fishbone Pack
Need to show step-by-step RCA? This template pack includes multiple slide variations: one with categories, one with solutions, and one with final conclusions.
Best For: Long presentations, Six Sigma teams, consultants
Features:
- Slide-by-slide breakdown
- Pre-labeled cause types (Man, Machine, Method, Material)
- Final root cause solution slide
5. Animated Fishbone Template
Animation brings movement to the slide, perfect for storytelling and training. This template uses simple transitions that reveal one branch at a time.
Best For: Webinars, corporate training, internal pitches
Features:
- Subtle slide animations
- Easy-to-follow build-up
- Text + visual balance
How to Choose the Right Fishbone Template
Not all RCA processes are the same. Here’s how to pick the right one for your purpose:
| Use Case | Recommended Template |
| Team Brainstorm | Color-Coded or Icon-based Template |
| Formal Report | Minimalist or Multi-Slide Pack |
| Classroom Use | Animated or Color-Coded Template |
| Six Sigma Work | Multi-Slide Pack with Cause Labels |
| Quick Summary | One-page Fishbone with Icons |
Tips for Presenting Root Cause Analysis in PowerPoint
- Start with the problem on the first slide
- Introduce categories one by one (use animation if needed)
- Focus on facts, not assumptions
- Keep the layout clean and avoid overloading branches
- Summarize findings with a solution slide at the end
Conclusion
Fishbone Diagrams are a timeless and effective tool for solving problems, improving processes, and educating teams. Instead of creating them from scratch, use professionally designed PowerPoint presentation templates to focus more on the analysis and less on formatting.
SlideEgg’s Fishbone templates give you the structure, clarity, and design you need to communicate root causes effectively.
Ready to solve your next big problem?
👉 Explore the best Fishbone Templates today!
FAQs
1. What is a Fishbone diagram used for?
To visually identify and organize the root causes of a problem.
2. Can I edit SlideEgg’s Fishbone templates?
Yes, all templates are fully editable in PowerPoint.
3. Are these templates useful for Six Sigma projects?
Absolutely. They’re ideal for DMAIC phases like Analyze and Improve.
4. Can I use these diagrams in classrooms?
Yes. Teachers and students can use them for assignments, discussions, and workshops.
5. Do the templates support animation?
Some templates include animation-ready designs for step-by-step explanation.