Boardroom decisions fail when clarity dies. If your slides look like a puzzle, your strategy will not get approved. High-level finance needs a visual system that handles deep data without losing the audience.
Stop using basic, disconnected slides. To command authority, you need a unified financial PowerPoint template system. These professional tools protect your data’s integrity from the first pitch to the final audit.
The Power of Visual Standardization
In finance, consistency is the foundation of trust. When your revenue charts, process flows, and risk assessments all share a unified design language, you reduce the “cognitive load” on your audience.
Instead of trying to figure out how to read a new chart on every page, stakeholders can focus entirely on your message. Standardizing your deck with professional templates ensures that your technical expertise is matched by your presentation’s authority, making your data undeniable.
1. Financial Services Company Profile

A strong first impression builds instant authority. This template uses a dark blue dashboard and growth charts to introduce your firm’s DNA. Use it to showcase past success and current capabilities to high-value clients. It moves your pitch from a basic introduction to a high-stakes strategic win.
2. 7 Steps of Investment Process
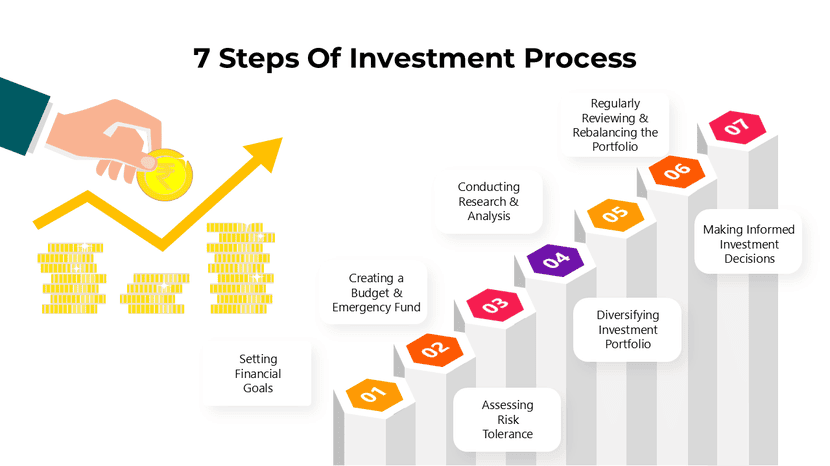
Venture capital and private equity teams require a clear roadmap. This slide uses numbered steps and icons to show exactly how you deploy capital. By mapping the journey from the initial screen to the final exit, it turns a complex process into a simple visual that builds deep institutional trust.
3. Financial Planning and Control
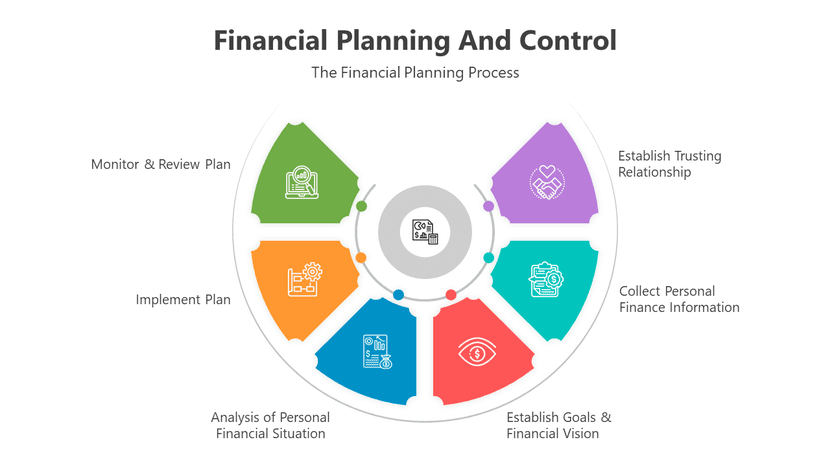
A plan is just a theory until it meets the real world. This framework tracks a project from the start to the final check, bridging the gap between strategic goals and operational results. It is the ultimate tool for CFOs who need to keep the board focused on real, measurable milestones.
4. ROI Infographics
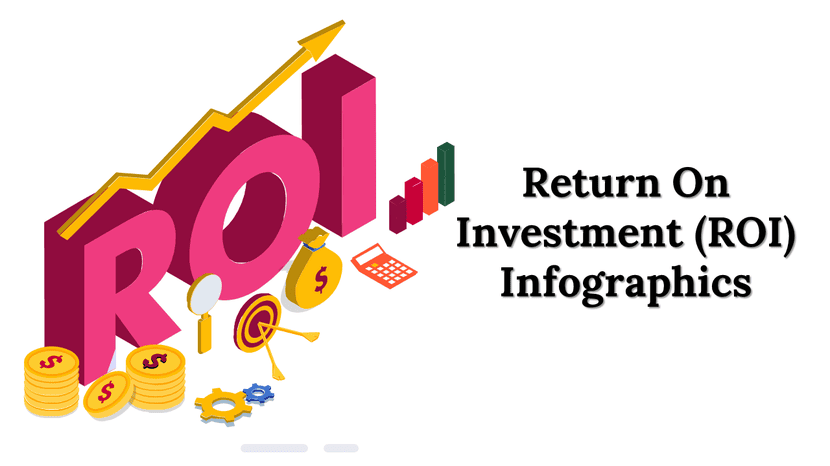
In a tight market, every dollar is under fire. Your ROI slide is your best defense when requesting capital. It uses bar charts and clear percentage tiles to prove an investment’s worth. It cuts out the noise so the board sees the profit potential and payback period immediately.
5. Related Party Transactions

Clear reporting is a regulatory mandate, not a choice. This template uses slides to show how cash moves between parent firms and subsidiaries. It creates a visual audit trail for compliance, protecting your firm during big reviews by documenting every internal money flow.
6. Online Payment Process

As Fintech scales, you must visualize how money moves digitally. This template outlines the payment journey for e-commerce and gateway flows. Use it to turn complex technical steps into a clear story for the board, ensuring every stakeholder understands the transaction security.
7. Crowdfunding Models

Modern funding requires modern visual tools. This template uses icons to explain different models, such as equity-based or reward-based funding. It is perfect for startups and new fundraising plans, allowing you to present “alternative” finance with the same weight as a traditional bank loan.
8. Financial Dashboard
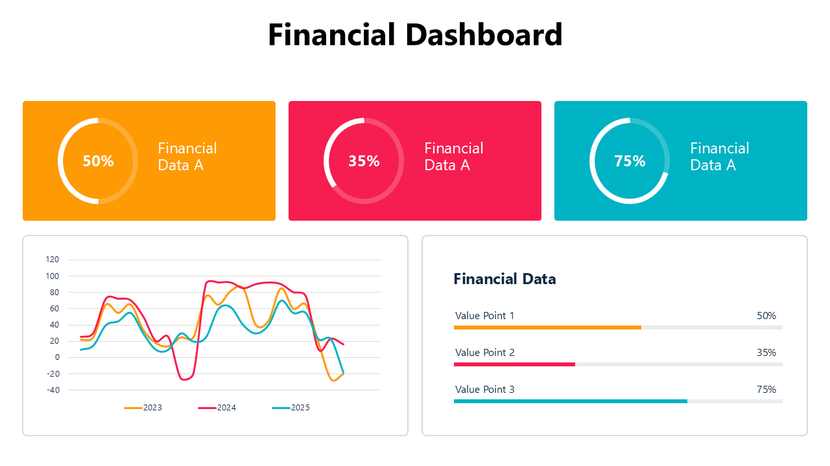
Static reports are too slow for 2026. You need a real-time view of your data. This layout puts KPIs and revenue charts on one high-impact screen. It helps a CFO spot margin leaks early and ensures the whole leadership team looks at the same financial facts.
9. Financial Goals
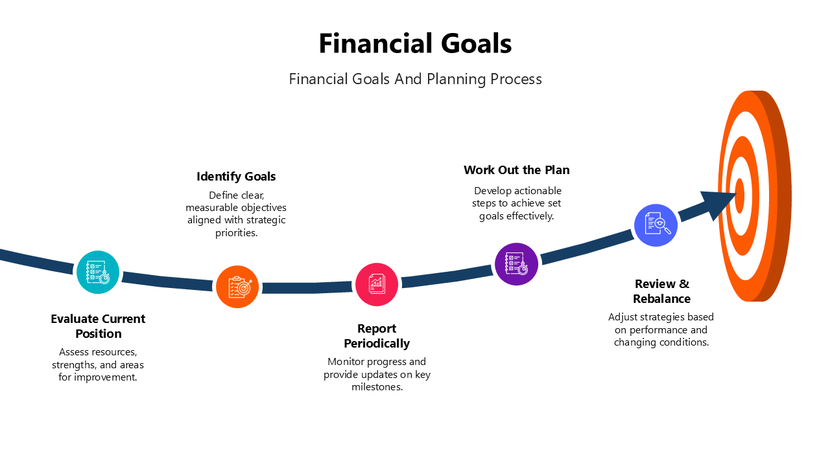
A target is just a wish without a map. This slide uses a timeline and milestone icons to show exactly where you stand. It tracks your fiscal goals throughout the year, creating a “visual contract” with the board that shows the clear path to profitability.
10. Business Funding and Revenue

When you raise funds, you must prove the health of your cash flow. This template uses high-fidelity charts to isolate revenue streams and funding rounds. It proves to investors that your business model is scalable, answering the “where” and “how” of your money in one view.
Frequently Asked Questions
1. Why use a full collection instead of single slides?
Consistency is key to authority. A full system ensures your ROI slides match your goal slides. This makes your deck look professional, reduces “brain drain” for your audience, and makes data easier to read.
2. Can I find niche topics like Tax or Microfinance?
Yes. The collection is vast. It includes specialized themes for Income Tax, Microfinance, and Cost Saving Initiatives to cover every corner of the financial sector.
3. Will these work with Google Slides?
Yes. Every design in the 830+ slide set is fully editable and works perfectly in both PowerPoint and Google Slides.
Conclusion: Precision is Your Power
Finance teams now lead company strategy. Don’t let your hard work die on a messy deck. Use a complete visual system to move from “reporting history” to “leading the future.” Clear slides lead to fast approvals and confident investors.