| Steps to Add Real-Time Data Using Google Sheets in Google Slides in a Snap ✅ Open Google Slides and click “Insert” → “Chart.” ✅ Choose “From Sheets” and select your Google Sheet. ✅ Pick the data range you want to link. ✅ Click “Import” and choose “Link to spreadsheet.” ✅ Your chart will now update automatically when the sheet data changes. |
Your presentations can now stay fresh with live data. No more copying and pasting numbers that go out of date. When you link Google Sheets to Google Slides, your charts and data update on their own.
This trick works great for sales reports, project updates, or any presentation that needs current numbers. Your audience will always see the latest information without you lifting a finger.
Why Real-Time Data Matters
Static presentations get old fast. But when you add real-time data to Google Slides, your slides become powerful tools that grow with your business. Your team can make better decisions with up-to-date information.
Think about monthly reports or dashboard presentations. Instead of recreating charts every time, you create them once and they stay current forever. This saves hours of work and prevents mistakes from manual updates.
Simple Steps to Link Your Data
Step 1: Prepare Your Google Sheet
Make sure your data is clean and organized. Put headers in the first row and keep your data in neat columns. This makes it easier to create beautiful charts later.
Step 2: Open Google Slides
Start a new presentation or open an existing one. Choose a slide where you want your live data to appear. Many Google Slides themes work perfectly with charts and data.
Step 3: Insert Your Chart
Click “Insert” in the top menu, then select “Chart.” You’ll see options for different chart types. Pick “From Sheets” to connect your spreadsheet.
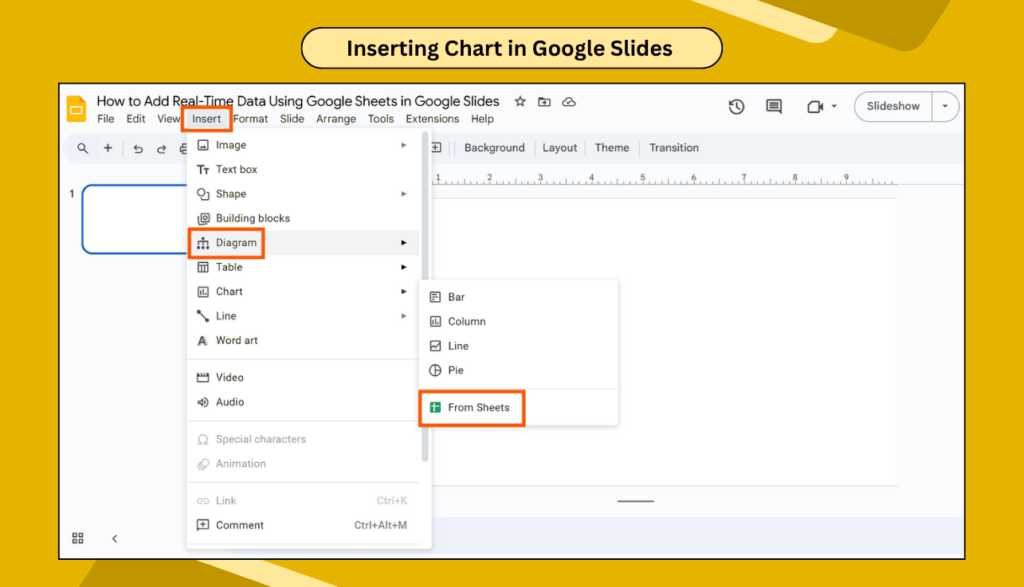
Step 4: Choose Your Data
Select the Google Sheet with your data. Pick the exact range of cells you want to include. You can choose specific columns or entire data sets.
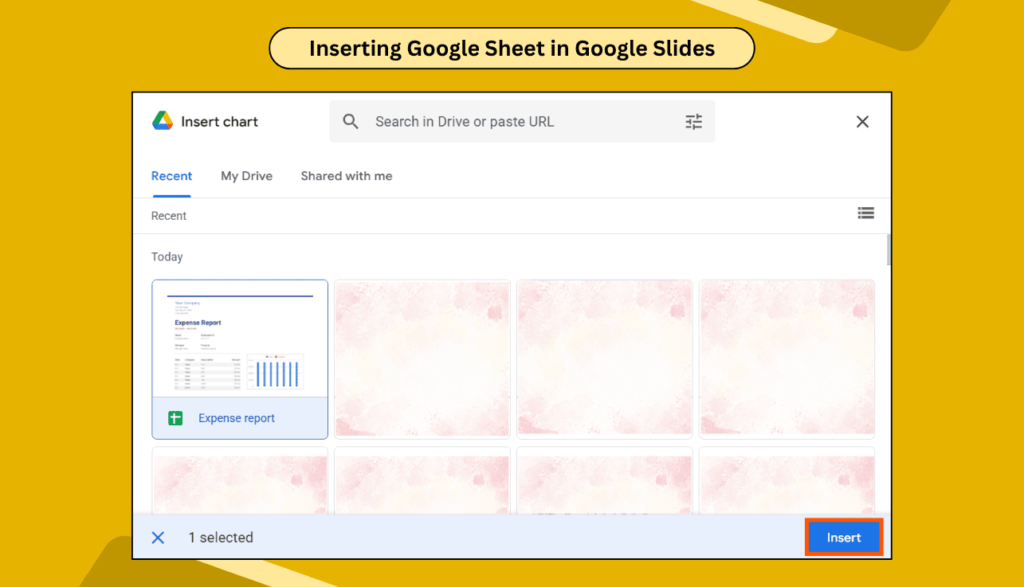
Step 5: Import and Link
Click “Import” and make sure to check “Link to spreadsheet.”
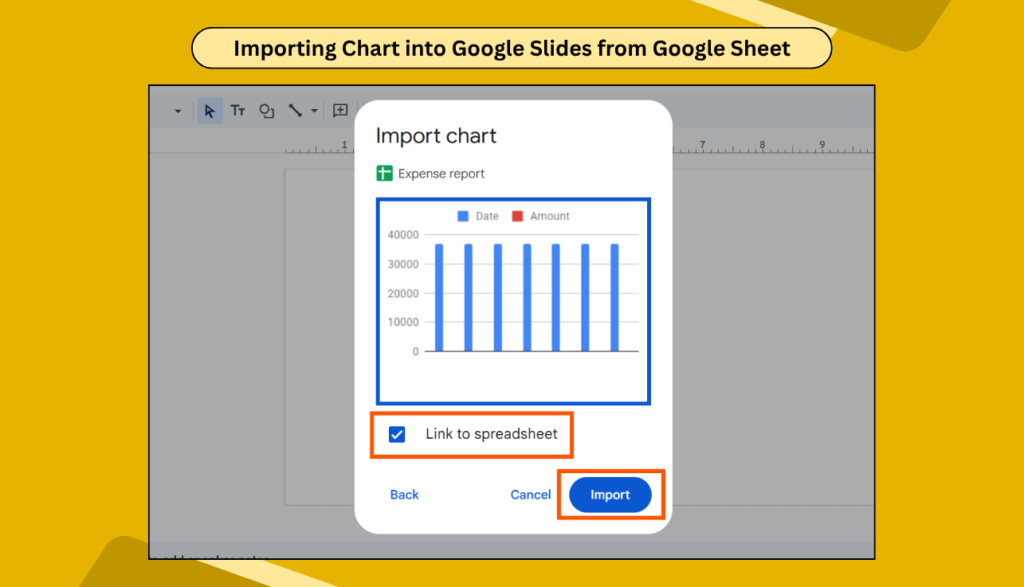
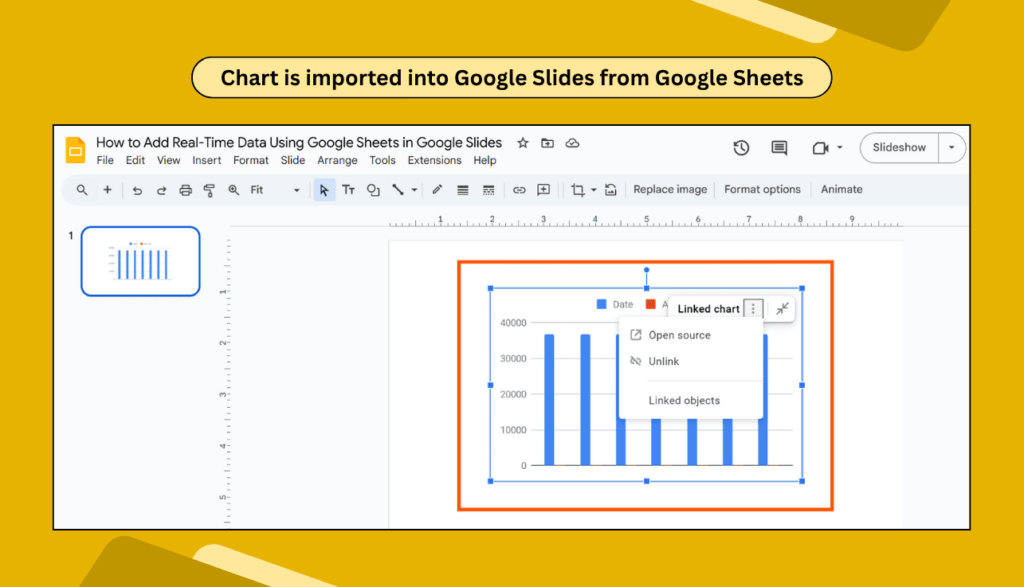
This magic checkbox makes your chart update automatically when your sheet changes.
Make It Look Amazing
Once your data is linked, you can style your chart to match your presentation. Change colors, fonts, and sizes to make everything look professional. The live connection stays active no matter how you customize the appearance.
You can also add animations in Google Slides to make your data presentations more engaging. Moving charts grab attention and help your audience focus on key numbers.
Keep Your Data Fresh
The best part about this method is that your slides stay current without extra work. When someone updates the Google Sheet, your presentation automatically shows the new information. This is perfect for team dashboards and regular reports.
Your linked charts work great when you share Google Slides with colleagues. Everyone sees the same live data, which prevents confusion and keeps teams aligned.
Advanced Tips for Power Users
You can link multiple charts from different sheets in one presentation. This creates comprehensive dashboards that tell complete stories with your data. Just repeat the linking process for each chart you need.
Consider using Google Slides for professional presentations by combining live data with other interactive elements. This makes your presentations stand out and keeps audiences engaged.
Troubleshooting Common Issues
Sometimes charts don’t update immediately. This is normal – Google needs a few minutes to sync changes. Refresh your presentation if you don’t see updates right away.
If your chart breaks, check that the original sheet still exists and hasn’t been moved or deleted. The link needs the source data to work properly.
Make Your Presentations Interactive
Live data is just the start. You can also create interactive Google Slides that respond to your audience. Combine this with your real-time charts for truly dynamic presentations.
Frequently Asked Questions
Q1: Can I update the data anytime?
Yes! Just edit your Google Sheet and the changes will appear in your presentation automatically. Updates usually happen within a few minutes.
Q2: Will the data change automatically in my presentation?
Absolutely. Once you link your sheet to your slides, all changes sync automatically. You don’t need to do anything extra.
Q3: Is this feature free to use?
Yes, linking Google Sheets to Google Slides is completely free. You just need a Google account to use both tools.
Q4: Can I use this with different types of charts?
Yes, you can create bar charts, line graphs, pie charts, and more. All chart types support real-time data connections.
Q5: What happens if I share my presentation?
Other people will see the same live data when you share your slides. The connection works for everyone who has access to view your presentation.
Your presentations will never feel outdated again. With real-time data from Google Sheets, your slides become living documents that grow with your business. Now your slides will always stay fresh and smart!