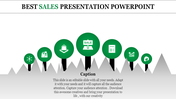
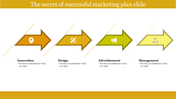
Sales Territory Plan PowerPoint Template and Google Slides

 Canva
Canva

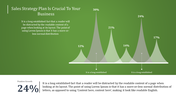
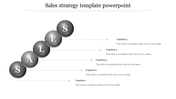

Sales Territory Plan Presentation Slide
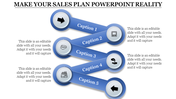
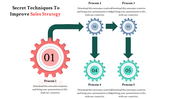
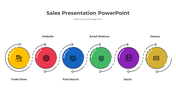
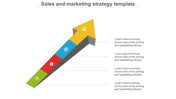
Visualize your sales strategy, identify opportunities for growth, and track your progress with ease. The six hexagonal shapes in our sales territory plan represent the key elements of a successful sales process, from prospecting and content creation to identifying needs, making offers, managing objectives, and closing sales. Ideal for sales managers, executives, and teams across various industries, this template can help you optimize your sales efforts and increase revenue. Impress your audience with a comprehensive and visually appealing sales territory plan.
Features of the template
- 100% customizable slides and easy to download.
- Slides are available in different nodes & colors.
- The slide contains 16:9 and 4:3 formats.
- Easy to change the colors of the slide quickly.
- Well-crafted template with an instant download facility.
- Optimize your sales process.
- Highly compatible with PowerPoint and Google Slides.
- Impressive slide for sales.


You May Also Like These PowerPoint Templates

Add to Wishlist
Download
Edit

Add to Wishlist
Download
Edit


Add to Wishlist
Download
Edit

Add to Wishlist
Download
Edit


Add to Wishlist
Download
Edit

Add to Wishlist
Download
Edit

Add to Wishlist
Download
Edit


Add to Wishlist
Download
Edit


Add to Wishlist
Download
Edit


Add to Wishlist
Download
Edit


Add to Wishlist
Download
Edit
