Customizable Project Timeline Templates PowerPoint

PowerPoint timeline template with years 2015 to 2019, featuring green and circular icons for each year with labels.
P.ID : 30156
    13 slides
    Multiple slide layouts displaying different project scopes with colorful diagrams and text boxes with icons.
    13 slides
    A pack of slides illustrating the 5 Stages of project life cycle, featuring colorful circular and hexagonal diagrams.
    13 slides
    Collection of project planning slides with Gantt charts and timelines, using different colors to represent task durations.
    161 views
    3 Downloads
    Get Custom Slides by Experts
    Instantly Access Templates in PowerPoint

    Timeline Milestones PPT Template and Google Slides


    The "Timeline Milestones PPT Template and Google Slides" is a versatile tool designed for showcasing project timelines effectively. Featuring a green and white color scheme with a world map background, this template offers a visually appealing layout. Each section of the template represents a year from 2015 to 2019, with dedicated space for a title, timeline, and project description. Users have the flexibility to modify the years according to their specific project timelines, enhancing customization.

    This template is ideal for project managers, team leaders, educators, and professionals across various industries who need to present project timelines and milestones. Whether it's for business presentations, academic projects, or research proposals, this template provides a clear and organized way to communicate project progress over time.

    Compatibility with PowerPoint and Google Slides. Available in 16:9 and 4:3 aspect ratios, catering to different screen sizes and presentation preferences. Provided in ZIP format for easy sharing and distribution. 100% customizable features. Download now.
    Advertisement

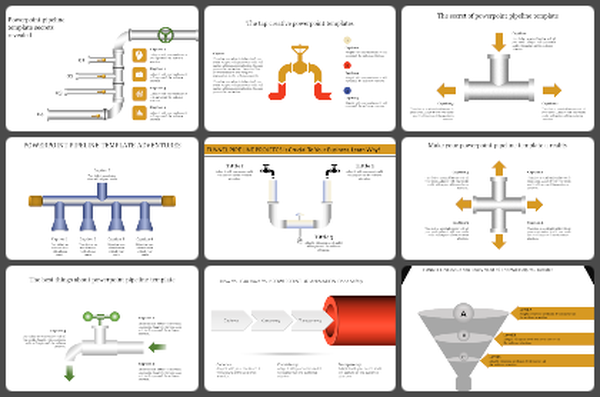
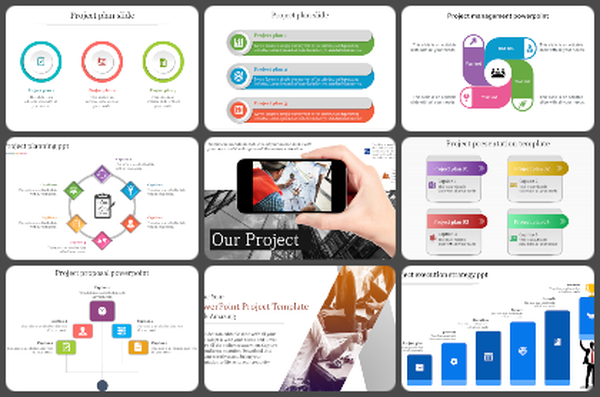
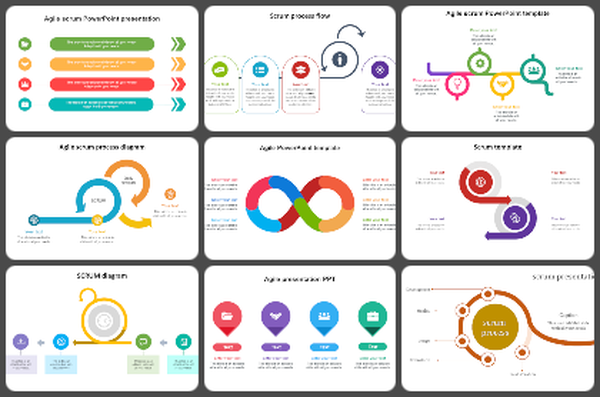
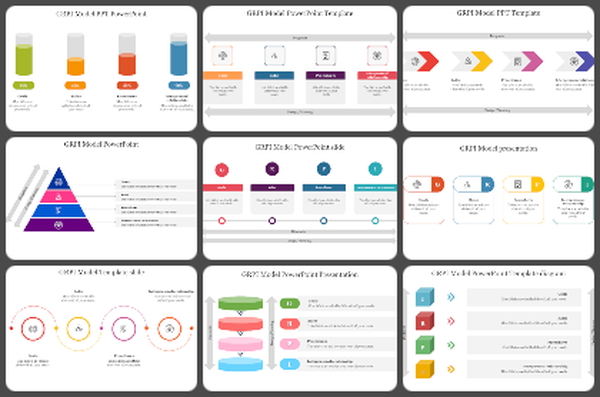
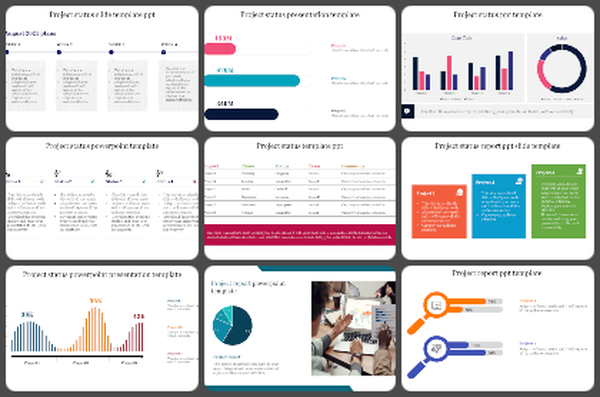
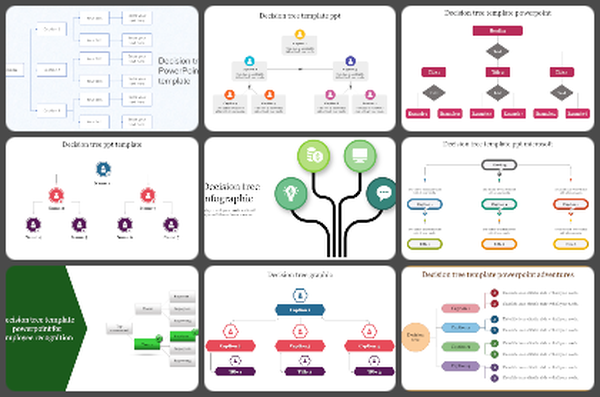
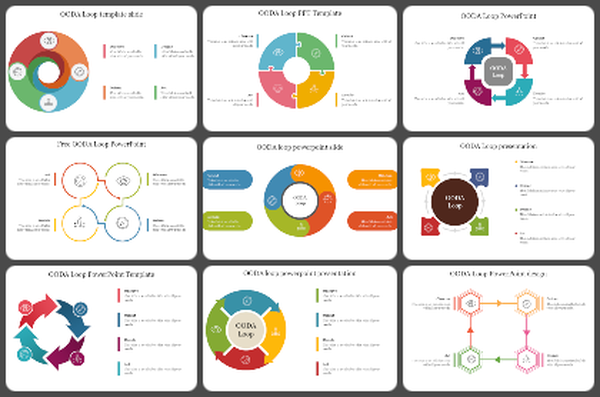
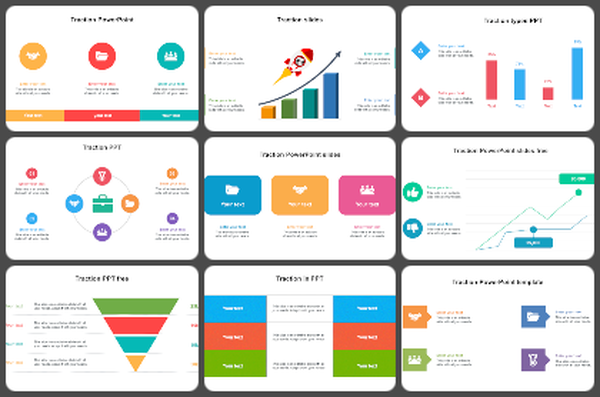
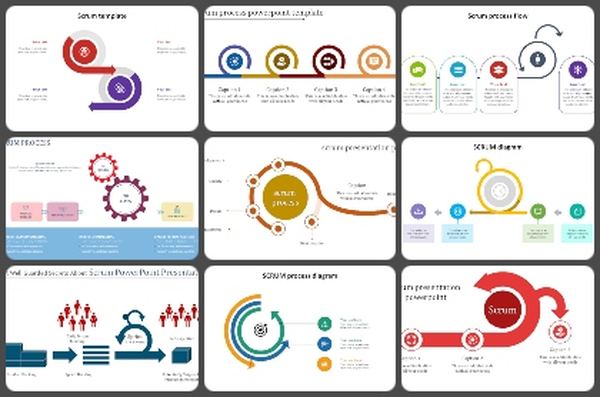
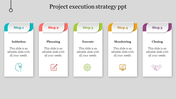
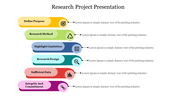
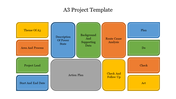
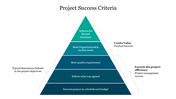
    You May Also Like These PowerPoint Templates

    Add to Wishlist
    Download
    AI Customize
    One-page project charter template format, highlighting many colored key sections with placeholder text.
    Free
    Add to Wishlist
    Download
    AI Customize
    Project demo slide with five stages and green colored icons with text descriptions.
    Add to Wishlist
    Download
    AI Customize
    Color coded hexagon shaped infographic slide displaying key project information with text captions.
    Add to Wishlist
    Download
    AI Customize
    Slide with company highlights in icons on a purple to blue gradient background, and six circular numbered sections below.
    Add to Wishlist
    Download
    AI Customize
    Project Charter layout with colored text blocks and a red pie chart, detail scope, goals, and team organization.
    Add to Wishlist
    Download
    AI Customize
    Pert Chart PPT Presentation Template and Google Slides
    Add to Wishlist
    Download
    AI Customize
    A flowchart resource planning slide outlining the process from capacity determination to personal and teamwork management.
    Add to Wishlist
    Download
    AI Customize
    A pack of slides featuring a collage of DMAIC showcasing colorful diagrams and icons with different layouts.
    Add to Wishlist
    Download
    AI Customize
    Flowchart with colored boxes in gray, red, yellow, blue, purple, orange, and pink, representing various stages and plans.
    Free
    Add to Wishlist
    Download
    AI Customize
    Five pillars of strategic project management slide with colorful placeholder text boxes and icons.
    Add to Wishlist
    Download
    AI Customize
    Colorful project governance structure diagram slide highlighting key roles and responsibilities.
    Add to Wishlist
    Download
    AI Customize
    Project phases slide showing stages from initiation to monitoring with key tasks under each phase with icons and text boxes.
    Add to Wishlist
    Download
    AI Customize
    Slide with a project schedule chart on the left and colorful icons with text captions on the right.
    Add to Wishlist
    Download
    AI Customize
    Five colorful phases listed with icons, next to a bar chart and caption area showing percentage values for each phase.