2700+ Process Presentation Templates

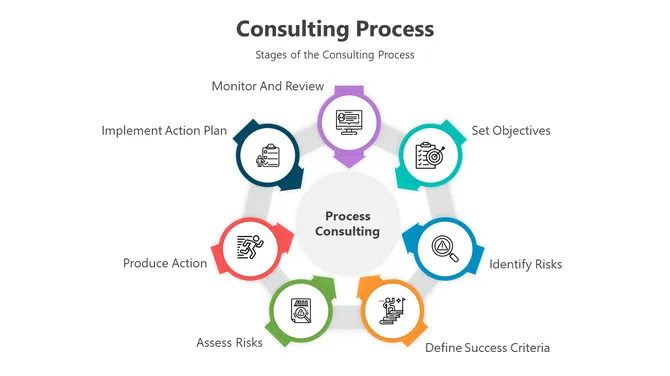
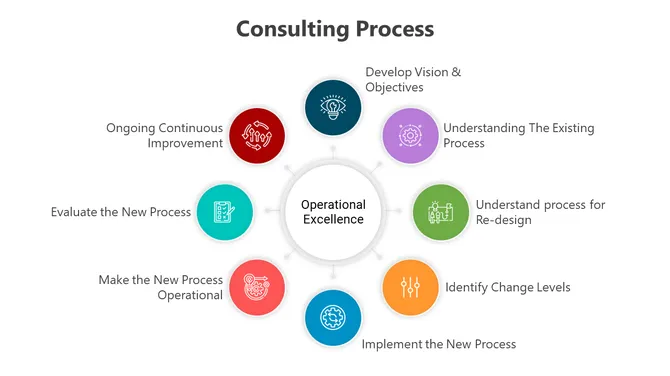
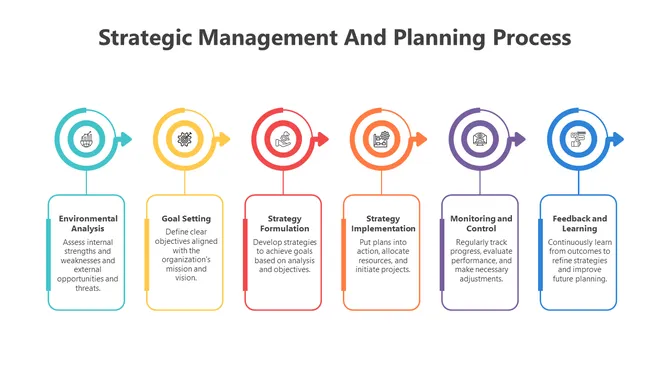
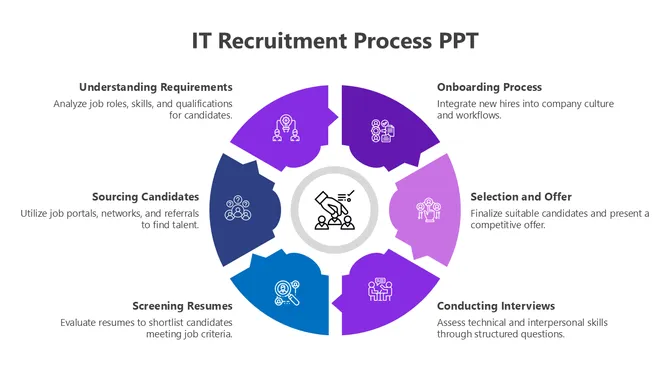
Explaining processes with words is hard. People hear the steps but don't see how they fit together. Process diagrams organize your workflow visually. Arrows show flow. Stages are clear. Everyone understands the same thing.

Got a Unique Idea? Craft with AI
PRO
Credits left : 0
Free
Add to Wishlist
Download
AI Customize
The Best Circular Arrow PowerPoint Download Slides
Free
Add to Wishlist
Download
AI Customize
Curved arrow template with five purple loops connected horizontally, each featuring a white icon and placeholder text.
Free
Add to Wishlist
Download
AI Customize
Horizontal red circular arrow graphic with five segments, each containing a white icon and labeled Caption 1 to Caption 5.
Free
Add to Wishlist
Download
AI Customize
A marketing strategy template with five arrows, each featuring an icon , with placeholder text areas for each section.
Add to Wishlist
Download
AI Customize
Green zigzag path infographic with six square icons representing business areas like strategy, marketing, and finance.
Add to Wishlist
Download
AI Customize
Wavy blue path with six connected business icons and corresponding text on a white background.
Add to Wishlist
Download
AI Customize
Infographic with three square text blocks in teal, red, and lime green, linked by arrows showing a looping directional path.
Free
Add to Wishlist
Download
AI Customize
Slide featuring four active sections with icons including scales of justice, a handshake, a book, and a gavel, with captions.
Free
Add to Wishlist
Download
AI Customize
Slide design with five red icons in oval shapes, each representing different concepts, connected by arrows.
Free
Add to Wishlist
Download
AI Customize
Horizontal layout with five dark hexagons numbered 1 to 5, each with an caption and black arrow between shapes.
Free
Add to Wishlist
Download
AI Customize
Blue hexagonal infographic showing five steps with alternating caption texts above and below connected by black arrows.
Free
Add to Wishlist
Download
AI Customize
Purple slide with five hexagonal shapes numbered 01 to 05, connected by arrows, with captions beneath each.
Free
Add to Wishlist
Download
AI Customize
Creative yellow zigzag flowchart with six outlined icons in boxes, alternating caption placements above and below each.
Add to Wishlist
Download
AI Customize
Premade PowerPoint Templates Presentation & Google Slides
Add to Wishlist
Download
AI Customize
Best Data Science Template Slides Presentation
Add to Wishlist
Download
AI Customize
Hiring process PowerPoint template shows six steps, each with icons for tasks such as screening, interviewing, and hiring.
Add to Wishlist
Download
AI Customize
A medical themed slide featuring four steps, each represented by icons and a blue color scheme.
Add to Wishlist
Download
AI Customize
Creative business diagram for presentation
Add to Wishlist
Download
AI Customize
Slide with four colorful diamond shaped icons in yellow, green, blue, and purple, connected in a sequence, with text below.
Add to Wishlist
Download
AI Customize
Horizontal layout with five gradient-colored circles, in purple, blue, and green, connected by a curved line.
Add to Wishlist
Download
AI Customize
A colorful flowchart PPT slide with various shapes, icons, and caption areas for each section on a white backdrop.
Add to Wishlist
Download
AI Customize
Template with five gradient arrows containing icons like target, bulb, and chart, with text areas below.
Add to Wishlist
Download
AI Customize
Slide with four colorful ovals in blue, green, pink, and orange, each containing icons and connected by arrows.

Free Process PowerPoint Templates And Google Slides Themes: Simplifying Communication


Why Presentations Matter for Processes

Presentations are like magic wands for explaining complex ideas. Imagine you’re baking a cake. Instead of handing someone a recipe book, you show them step-by-step pictures of mixing flour, eggs, and sugar. That’s what presentations do—they turn boring instructions into visual stories.

How Our Slides Can Help You

Our process presentation templates are like superhero capes for your ideas. They make your messages fly! Here’s why they’re awesome:

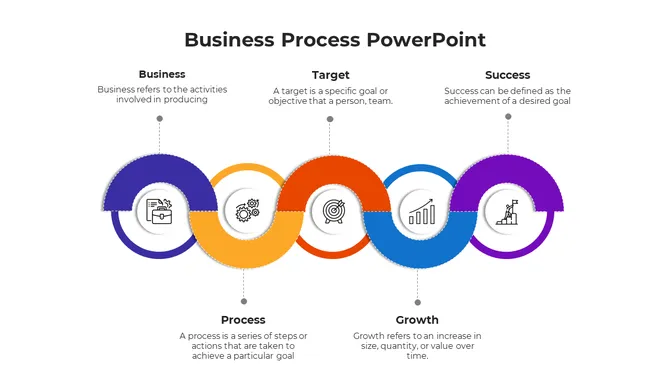
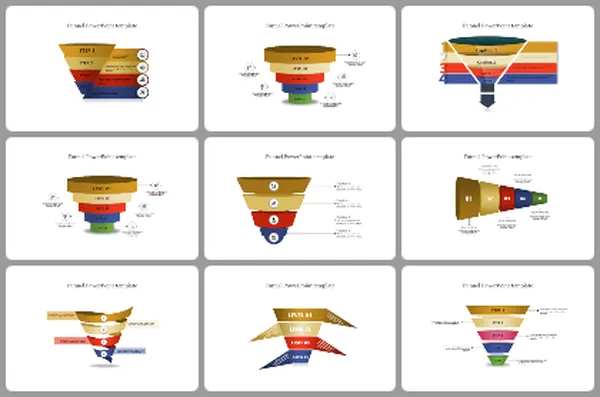
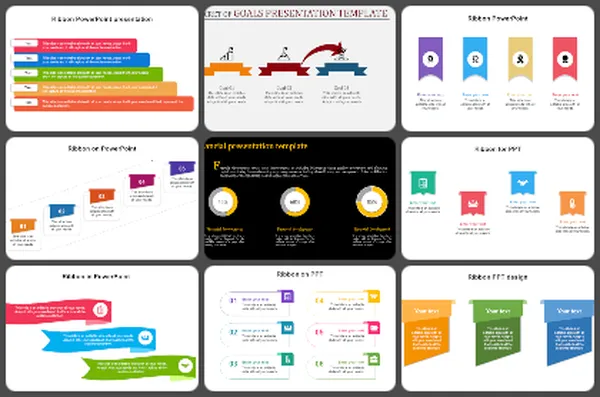
  • Multicolor Infographic Slides: Think of these as your canvas. They’re not just slides; they’re vibrant artworks. Use colors to highlight key points and keep your audience awake.
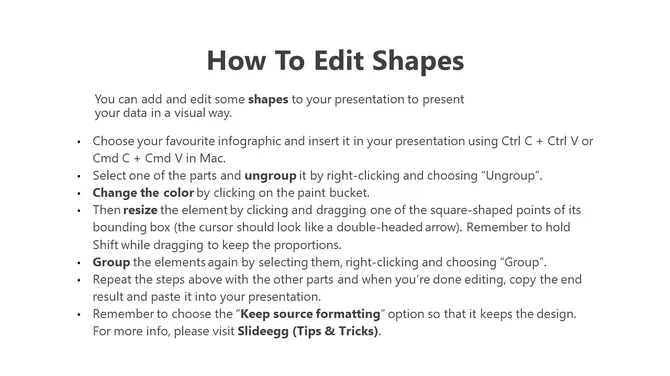
  • Editable Graphics and Text: Imagine a coloring book where you can change the colors, add your text, and even draw extra doodles. Our slides are like that—100% customizable.
  • Multiple Node Selections: Present processes, steps, and concepts effortlessly with required nodes.
  • Royalty-Free Goodness: No copyright issues! Our slides are yours to use without fear. 
  • Formats for All Occasions: Whether you’re presenting on a big screen or a tiny phone, we’ve got you covered. Choose 4:3 for classic vibes or 16:9 for widescreen. Portrait or landscape? Both orientations are available.
  • Free Slides: Some slides are freebies. Try them before purchasing.

Who Can Use Our Process Slide Templates?

Our slides can be used by different types of people. If you're a business wizard like a CEO or manager, these slides are for you. Students can use them to impress their classmates and teachers during project presentations. Teachers can make their lessons more exciting by using these slides. Event planners can add a touch of excitement to their event introductions and summaries. And if you're a creative person, whether you're a designer, marketer, or someone full of ideas, these slides can help you showcase your work effectively.

Themes You’ll Find Here

In our collection of process slides, you'll discover many different themes. We've got slides about pricing strategies, business strategy planning, supply chain management, sales and marketing strategies, etc. We also offer slides on generic themes, like photosynthesis, butterfly life cycles, etc. Need to illustrate ideas with flow diagrams? We've got arrows, boxes, and flowcharts—like GPS for your thoughts. 

Ready to Transform Your Presentations? Try our versatile, handy, editable process PowerPoint slides to tackle any presentation challenge.

Related Collections

Frequently Asked Questions

1. How do I choose which process to visualize first?

Start with the process that causes the most confusion or problems. Hiring? Customer onboarding? Manufacturing? Pick the one where miscommunication costs you time or errors. Visualize that first. Success there builds momentum for other processes.

2. What should every process diagram include?

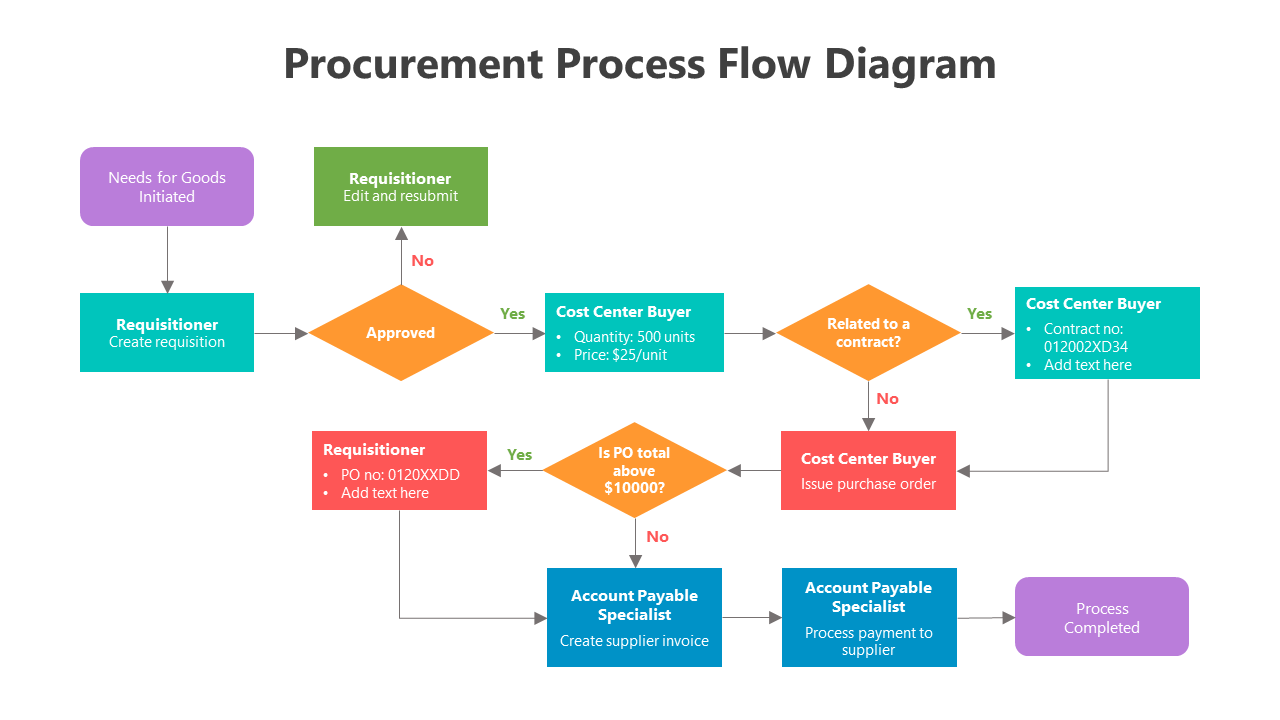
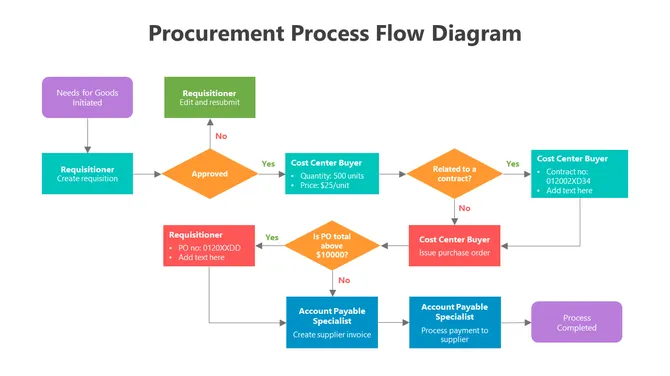
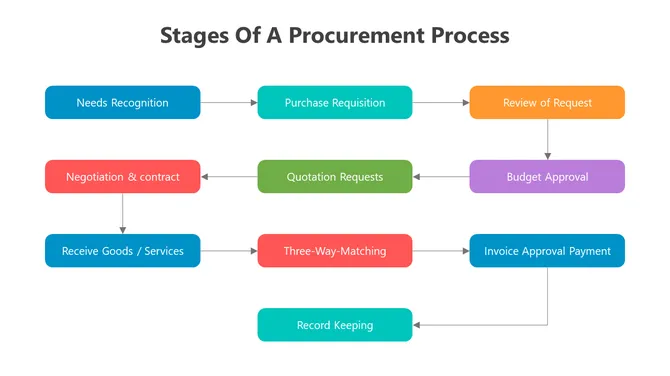
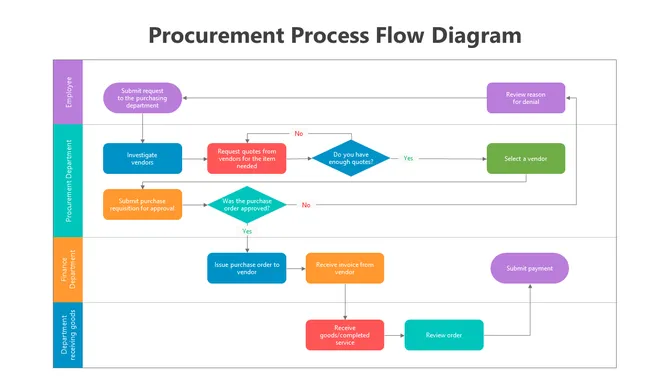
Start point and end point. All major steps in order. Decision points (yes/no branches). Who does what at each step. How long each step takes. Where handoffs happen between people or departments. A clear visual makes these elements obvious.

3. How do I explain my process to new team members clearly?

Walk them through the visual diagram step by step. Point to each stage. Explain what happens and why. Have them trace the flow themselves. Ask questions to check understanding. Visuals speed up training because people see the whole picture before diving into details.

4. What's the best way to show process bottlenecks or problems?

Use color coding: green for smooth steps, yellow for slow steps, red for bottlenecks. Or add timing to each step — if it takes too long, flag it. Visual bottlenecks are obvious. Then you can discuss solutions with data, not opinions.

5. Should I include every tiny detail in my process diagram?

No. Include decision points and major steps. Skip minor tasks that happen within a step. Too much detail creates confusion, not clarity. Your diagram should be readable in 2-3 minutes, not require a manual to understand.

6: How do I update a process diagram when the workflow changes?

Document what changed and why. Update the diagram. Share it with everyone affected. Make it a habit to review processes quarterly. When processes change but diagrams don't, confusion returns. Keep visuals current.

7. How do I get buy-in for a new process from my team?

Show them the current process visually. Show them the new process visually. Point out differences. Explain why each change improves things. Let them ask questions. Visuals make the "before and after" obvious, so people understand the reasoning.