Infographics Presentation Templates

Transform your shows with 2800+ infographic templates from SlideEgg. Easily visualize complicated information, interact with your target market, and create expert slides with customizable PowerPoint, Google Slides, and Canva designs. Ideal for any discipline!
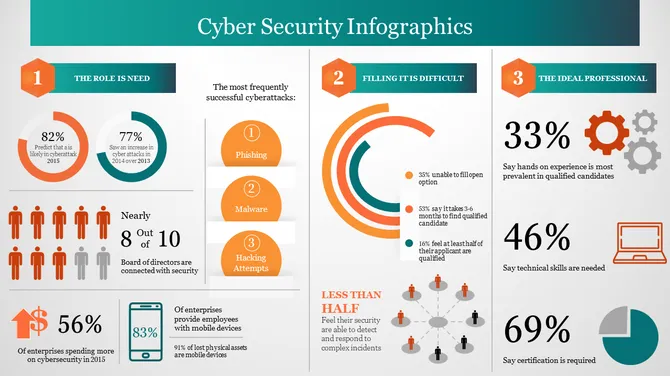
Add to Wishlist
Download
AI Customize
Infographic with five colorful lightbulb icons arranged in a semicircle with a central glowing lightbulb encircled.
Free
Add to Wishlist
Download
AI Customize
Infographic PowerPoint template featuring four orange hot air balloons, each representing percentages with captions.
Free
Add to Wishlist
Download
AI Customize
Five gray hot air balloons representing different percentages, with captions below each.
Free
Add to Wishlist
Download
AI Customize
Three colorful hot air balloons in green, pink, and blue, with percentage values and captions below.
Free
Add to Wishlist
Download
AI Customize
Balloon chart featuring three red hot air balloons displaying percentages, with a title and descriptive captions underneath.
Free
Add to Wishlist
Download
AI Customize
Infographic PPT slide with four stacked blocks in grey, each representing Business, Process, Target, and Profit with icons.
Free
Add to Wishlist
Download
AI Customize
Infographic slide featuring a 3D wavy gray platform with two purple spheres and captions on either side.
Free
Add to Wishlist
Download
AI Customize
Slide featuring six gray colored rectangular text boxes, each labelled with a number and caption.
Free
Add to Wishlist
Download
AI Customize
Infographic PowerPoint slide showing five green steps, with descriptions for business, process, target, growth, and profit.
Free
Add to Wishlist
Download
AI Customize
Blue themed infographic with four numbered arrows inside circles, illustrating sequential steps.
Free
Add to Wishlist
Download
AI Customize
Four step infographic with red circular arrows labeled 1 to 4, each representing business growth stages.
Free
Add to Wishlist
Download
AI Customize
Dynamic spiral chart with four red concentric layers, each labeled with percentages and captions.
Free
Add to Wishlist
Download
AI Customize
Best infographic slide design featuring five grey blocks stacked with silver supports, each section labeled for captions.
Free
Add to Wishlist
Download
AI Customize
Gray themed infographic with five step based text boxes arranged in a horizontal line format.
Add to Wishlist
Download
AI Customize
Infographic diagram featuring six multicolored segments, forming a hexagonal shape with a handshake icon in the center.
Add to Wishlist
Download
AI Customize
Infographic design with four icons for analytics and megaphone, connected by lines, each with a placeholder text areas.
Add to Wishlist
Download
AI Customize
Cycle infographic with three labeled points, featuring transparent and striped circles in blue, green, and gray.
Free
Add to Wishlist
Download
AI Customize
Infographic slide with three blue half circles, paired with white icons and captions, arranged in a row.
Free
Add to Wishlist
Download
AI Customize
Three red semicircular graphics with captions inside and icons in white circles below each label.
Free
Add to Wishlist
Download
AI Customize
Infographic with four blue cards labeled Business, Process, Target, and Growth, each with icons in white corner boxes.
Free
Add to Wishlist
Download
AI Customize
Infographic PPT slide featuring Business, Process, Growth, Profit, and Success with matching icons and purple color arrows.
Free
Add to Wishlist
Download
AI Customize
Infographic PPT slide featuring five sections with captions and icons in an orange circular layout on a white backdrop.
Free
Add to Wishlist
Download
AI Customize
Slide with four blue rectangular sections, each with a business icon and text, framed with dashed lines.

Frequently Asked Questions

What are Infographics PowerPoint Templates?

Infographics PowerPoint templates are the best presentation tool designed with awesome themes to represent your business, product or services, sales, and marketing data in a visually striking way to the audiences.

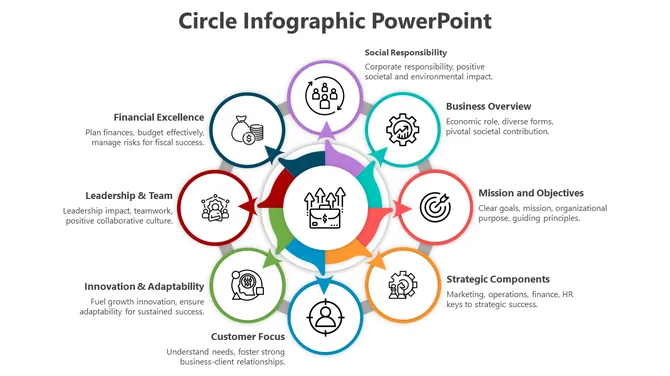
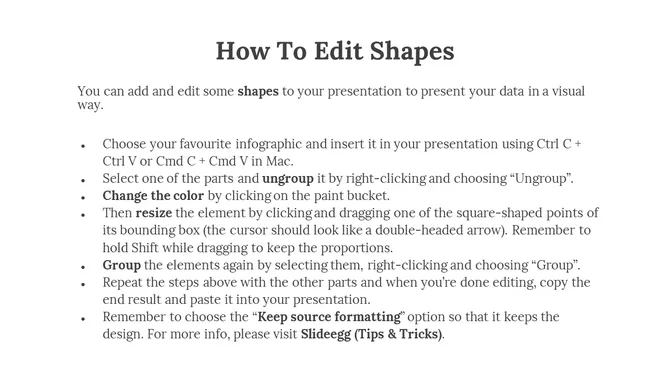
What elements should I include in my infographic?

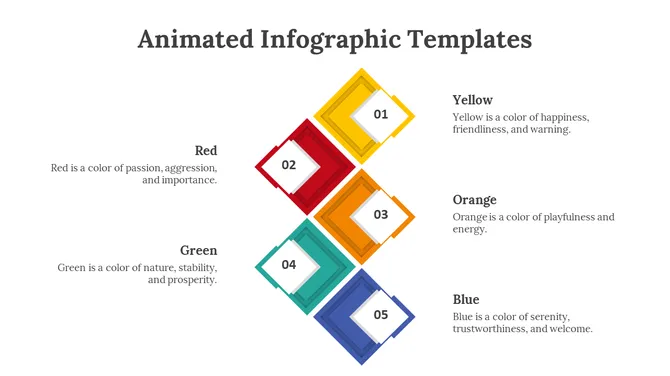
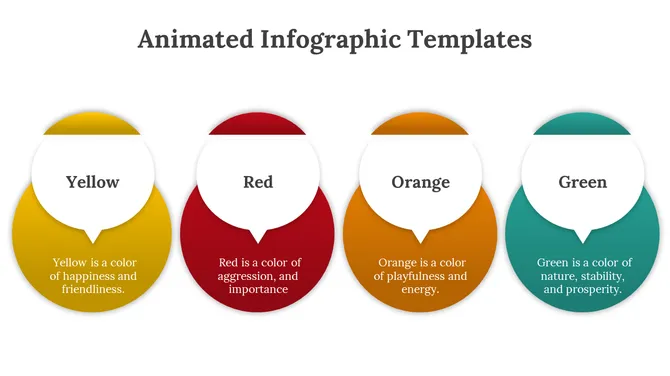
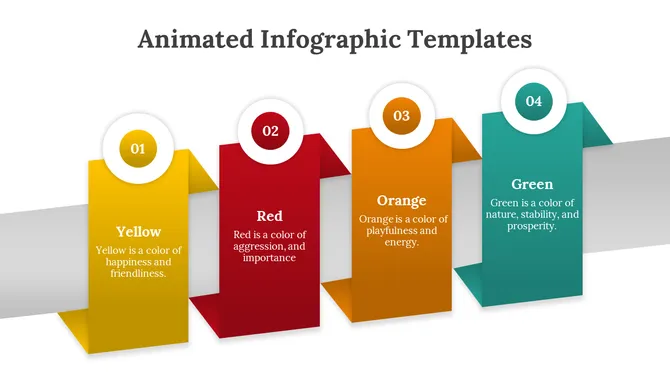
One way to come up with an effective infographic is by adding a striking title, a main idea (not more than one sentence), numerical information (tables, signs), well-structured parts with headings, appealing images (objects, shapes), and lastly, the orderly manner of properly presenting data must be provided for in this regard.

What is the best way to present my infographic in a presentation?

Get ready for your presentation to go as if there are no obstacles to it by practicing it a few times before showtime. Explain the main ideas of the infographic directly and using concise language.

Why are infographics effective for presentations?

Infographics help people to digest data more quickly, they attract and hold the listeners’ attention, as well as, help in understanding it better. As for comprehension, silver bullets are superior alternatives to words for they imply complex ideas in a digestible manner.

Who can benefit from using infographics in presentations?

Various professionals can utilize infographics to illustrate their points, namely corporate executives, teachers, scholars, financial experts and event organizers.

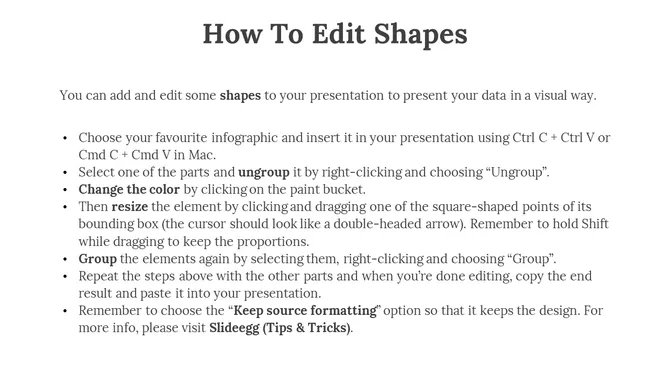
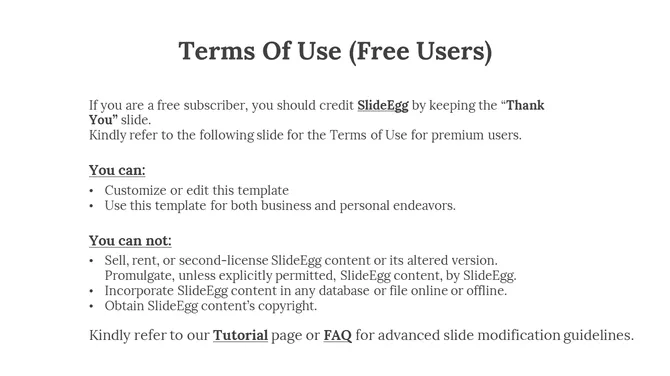
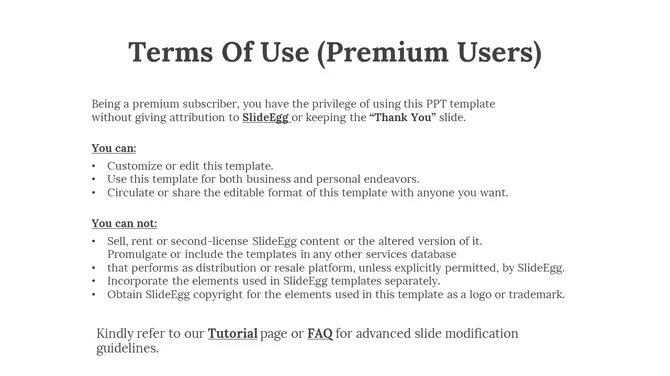
Are the infographic templates customizable?

Yes, you are free to change the text and insert your images together with your branding.

Are the templates compatible with different platforms?

Of course, the slides are available for PowerPoint, Google Slides, and Canva. You just need to be sure that you can get the slide from the source and present it to the audience, no software is needed for them to view the slides.