Finance PowerPoint Template for Financial Reports and Data

Financial themed infographic with a central money bag icon connected to eight circular sections, each with icons and caption areas.
P.ID : 9218
    1.7K+ views
    178 Downloads
    Get Custom Slides by Experts
    Instantly Access Templates in PowerPoint

    Finance Presentation Template


    Presenting financial information effectively is crucial for making informed decisions. Our "Finance PowerPoint Presentation Template" offers a comprehensive and visually appealing solution for conveying complex financial data clearly and engagingly.

    Slide Description:

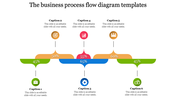
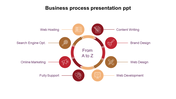
    Our slide central graphic features eight circles connected to the center. Each circle represents a point or concept. Each circle contains an icon (e.g., lightbulb, gears, trophy) labeled with “Caption” followed by numbers 1 through 8. These icons likely symbolize different finance-related ideas or processes. There are two text boxes on either side of the central graphic.


    Who can benefit?

    Professionals in the finance sector (e.g., analysts, accountants, financial advisors) Business students studying finance. Anyone needing to convey complex financial concepts effectively.


    How can users benefit from this template?

    Customization: Users can adapt the slide to their specific content. Clarity: The organized layout helps convey information.


    Download our templates to enhance your presentations with professional design and clear data visualization. 


    Features of the template:


    • Slides are available in 4:3 & 16:9
    • Well-crafted template with instant download.
    • Get slides that are 100% customizable and easy to download
    • Highly compatible with PowerPoint, Google Slides and Canva templates
    Advertisement

    You May Also Like These PowerPoint Templates

    Add to Wishlist
    Download
    AI Customize
    Slide with a segmented circle in rainbow colors labeled A to G, surrounded by six text boxes.
    Add to Wishlist
    Download
    AI Customize
    Causal loop diagram slide illustrating relationships between electricity generation, demand, and business growth.
    Add to Wishlist
    Download
    AI Customize
    Illustrated smartphone surrounded by colorful icons representing mobile app functions in business communication.
    Add to Wishlist
    Download
    AI Customize
    A diagram slide featuring three interlocking circles in teal, red, and green colors with icons and placeholder text in each.
    Add to Wishlist
    Download
    AI Customize
    Customizable Deforestation Causal Loop Diagram PowerPoint
    Free
    Add to Wishlist
    Download
    AI Customize
    Cycle diagram featuring six red sections arranged in a circular shape with arrows, each labeled with captions areas.
    Add to Wishlist
    Download
    AI Customize
    Deforestation slide with interconnected orange arrows, text nodes, and green elements inside a blue border.
    Add to Wishlist
    Download
    AI Customize
    Visual representation of a causal loop diagram focusing on irrigation management, with key loops.
    Add to Wishlist
    Download
    AI Customize
    Circular flow diagram of economics slide showing interactions between four colored sections on a white backdrop.
    Free
    Add to Wishlist
    Download
    AI Customize
    Hexagonal red circle infographic with six sections, each containing an icon and a caption.
    Add to Wishlist
    Download
    AI Customize
    Diagram illustrating the habit loop with three stageconnected by arrows in a circular flow, with placeholders text.
    Add to Wishlist
    Download
    AI Customize
    Causal loop diagram slide illustrating factors influencing business activity and commercial space availability.
    Add to Wishlist
    Download
    AI Customize
    Colorful circular diagram with four arrows in teal, red, purple, and blue, each labeled with numbers.
    Add to Wishlist
    Download
    AI Customize
    Causal diagram on deforestation with interconnected loops, arrows, and orange circular feedback icons.
    Free
    Add to Wishlist
    Download
    AI Customize
    Green circular flowchart with five white icons, each connected to text boxes on the sides by arrows.
    Free
    Add to Wishlist
    Download
    AI Customize
    Circular diagram in shades of purple with six segments, each numbered and pointing to text boxes.
    Add to Wishlist
    Download
    AI Customize
    Circular project flow diagram with five stages displayed in colorful segments and arranged around a central icon.
    Add to Wishlist
    Download
    AI Customize
    Customizable Causal Loop Diagram PowerPoint Slide
    Add to Wishlist
    Download
    AI Customize
    Circular infographic design with four green icons representing business, goals, growth, and finance, arranged around arrows.