Infographic PowerPoint Slides for Engaging Reports

Infographic PowerPoint slides and Google Slides
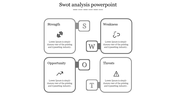
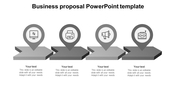
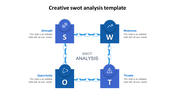
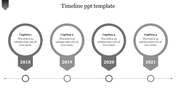
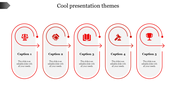
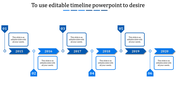
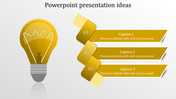
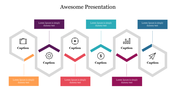
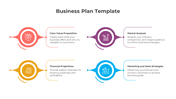
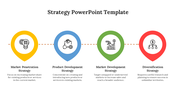
Unlock the potential of your presentations with our Infographic PowerPoint slides and Data Visualization PowerPoint templates. Elevate your storytelling with a seamlessly designed tag, emphasizing clarity and impact. Our templates boast a dynamic four-node structure, providing a structured flow to your information. The professional touch is evident in the use of multiple shades and colors, meticulously chosen to evoke engagement and understanding. Whether you're crafting a creative presentation that demands visual flair or a business pitch requiring a polished edge, these templates humanize your data, making it not just comprehensible but also captivating. Transform your ideas into a compelling narrative, leaving a lasting impression on your audience.
Features of the template
- 100% customizable slides and easy to download.
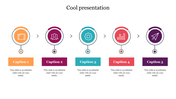
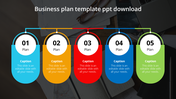
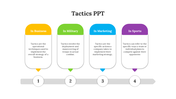
- Slides are available in different nodes & colors.
- The slides contain 16:9 and 4:3 formats.
- Easy to change the colors quickly.
- It is a well-crafted template with an instant download facility.


You May Also Like These PowerPoint Templates
Add to Wishlist
Download
Edit

Add to Wishlist
Download
Edit


Add to Wishlist
Download
Edit

Add to Wishlist
Download
Edit

Add to Wishlist
Download
Edit

Add to Wishlist
Download
Edit

Add to Wishlist
Download
Edit


Add to Wishlist
Download
Edit

Add to Wishlist
Download
Edit


Add to Wishlist
Download
Edit

Add to Wishlist
Download
Edit

Add to Wishlist
Download
Edit


Add to Wishlist
Download
Edit
